🔄 Circular Dichroism (CD)
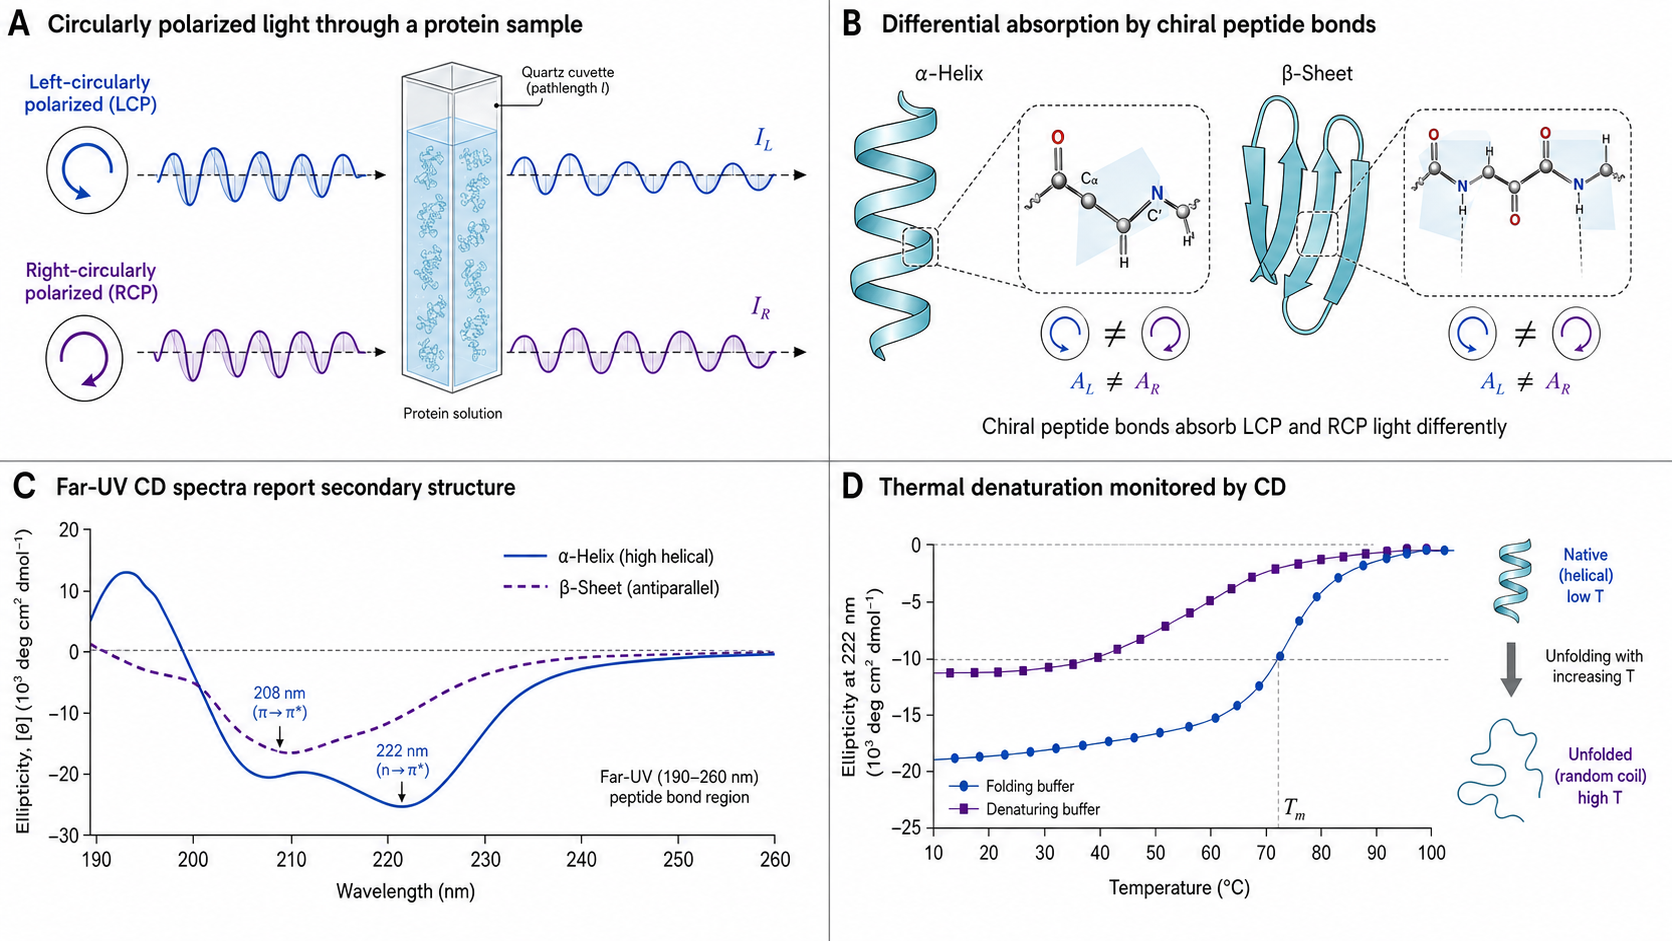
Circular dichroism measures the differential absorption of left- and right-circularly polarized light by chiral molecules. Since the peptide backbone is chiral and its CD signal depends on secondary structure, far-UV CD (190–250 nm) provides a rapid, quantitative estimate of α-helix, β-sheet, turn, and random coil content. Near-UV CD (250–320 nm) probes the environment of aromatic side chains, reporting on tertiary structure and conformational integrity.
CD is not a binding kinetics technique — it doesn't measure ka or kd. Think of it as complementary to SPR and BLI: use CD to confirm your protein is folded before running kinetics experiments. It's also the standard method for measuring thermal stability (Tm) via temperature-dependent unfolding.
Key Physics Concepts
Circularly Polarized Light
Left-CPL and right-CPL rotate in opposite directions. Chiral molecules absorb them unequally — the difference is the CD signal. Only molecules with chirality (like proteins, nucleic acids) produce CD spectra.
Chromophores
Far-UV (190–250 nm): peptide bond n→π* and π→π* transitions — reports on secondary structure. Near-UV (250–320 nm): aromatic side chains (Trp ~280–295, Tyr ~275–285, Phe ~255–270 nm) and disulfide bonds — reports on tertiary structure.
Beer-Lambert for CD
ΔA = AL − AR (by convention; α-helix gives negative ΔA at 208 and 222 nm). By definition, θ (deg) ≈ 32.98 × ΔA, though instruments measure mdeg directly via lock-in detection of (IL − IR)/(IL + IR). Normalize to mean residue ellipticity: [θ]MRE = (θmdeg × MRW) / (10 × c × l), where c is in mg/mL and l in cm. The factor of 10 converts c (mg/mL → g/L) and l (cm → dm) to put MRE on a deg·cm²·dmol⁻¹ basis.
Alternative unit: Δε (molar circular dichroism, M⁻¹cm⁻¹) = ΔA / (cmol × l). Conversion: [θ]MRE = 3298.2 × ΔεMR, where ΔεMR is the mean-residue Δε (per peptide bond, not per whole protein) — using a whole-protein Δε underestimates by a factor of N (residues). Modern literature and PCDDB increasingly use ΔεMR.
Interactive CD Spectrum Builder
Build a far-UV CD spectrum by adjusting the secondary structure composition. This is the forward problem — real CD analysis does the inverse (spectrum → composition) using algorithms like CONTIN, SELCON3, or CDSSTR via DichroWeb.
Approximate — DSSP vs CD deconvolution can differ by 5–10%
Educational approximation: This linear combination model is a pedagogical simplification. Real CD spectra also depend on helix chain length (short helices give weaker [θ]₂₂₂ per residue), aromatic contributions, and solvent effects. For quantitative secondary structure analysis, use DichroWeb or BeStSel.
Thermal Denaturation Simulator
Simulate a CD thermal melt experiment using a reversible two-state model. Adjust the melting temperature (Tm) and van't Hoff enthalpy (ΔHvH) to see how cooperativity affects the unfolding transition.
Higher ΔHvH = sharper transition (more cooperative unfolding). Typical globular proteins: 200–500 kJ/mol.
Reversibility caveat: This simulator models reversible two-state unfolding. In practice, most protein thermal melts are irreversible (aggregation at high T). Irreversible Tm depends on scan rate and is not a true thermodynamic parameter. Always run a re-cooling scan to test reversibility. The model also ignores ΔCp (heat capacity change upon unfolding), which causes baseline asymmetry in real data.
dθ/dT maximum corresponds to Tm (the inflection point of the sigmoidal melt curve). Sharper peaks indicate more cooperative unfolding.
Concentration & Path Length Effects
Raw CD signal (mdeg) scales linearly with concentration and path length. Mean residue ellipticity ([θ]MRE) normalizes this out — that's why you must always report MRE, not raw millidegrees.
[θ]MRE = (θmdeg × MRW) / (10 × c × l)c in mg/mL, l in cm, MRW ≈ 113 Da (mean residue weight)
Practical Considerations
📝 Sample Preparation
- Buffers: Phosphate (≤ 20 mM) is the safest for far-UV; Tris and HEPES become absorptive below ~200–205 nm. Avoid imidazole and DTT (both absorb strongly below 230 nm). For chloride > ~150 mM, substitute NaF — Cl⁻ absorbs strongly below 200 nm. DMSO is tolerable at low % (< 1–2%) for screens.
- Far-UV path × concentration: what matters is the product c × l. Common pairings: 0.5–1 mg/mL × 0.1 mm (0.01 cm), or 0.1–0.2 mg/mL × 1 mm. Short paths are needed because buffer/water absorbance dominates below 200 nm — the Concentration Simulator below illustrates this.
- Near-UV concentration: 0.5–2 mg/mL with 1 cm path length (higher concentration needed — aromatic side-chain signals are much weaker per residue than peptide backbone signals).
- Concentration accuracy: Must be precisely determined (A280 or BCA) — errors propagate directly into [θ]MRE.
⚙️ Instrument & Measurement
- N₂ purging: Essential below ~200 nm to displace O₂ absorption and suppress ozone formed by the deep-UV lamp.
- HT (dynode) voltage: Discard data where HT exceeds the manufacturer's threshold (typically ~600–700 V on Jasco) — this indicates insufficient light reaching the detector and unreliable signal.
- Sample purity: Aggregates and contaminants distort spectra significantly.
- Near-UV CD (tertiary structure) is underappreciated — useful for lot-to-lot consistency checks in biosimilar development.
- SRCD (synchrotron radiation CD) extends the usable range to ~170 nm, providing additional structural information.
ΔTm — CD Thermal Shift for Ligand Binding
A ligand that binds and stabilizes a protein shifts the melting temperature upward: ΔTm = Tm(+ligand) − Tm(apo). A positive ΔTm is evidence of binding and stabilization.
What ΔTm tells you
- Positive ΔTm: ligand stabilizes the native state
- Larger ΔTm generally correlates with tighter binding (but not linearly)
- Useful for rank-ordering compounds in early drug discovery
- Can detect binding even when other methods fail (aggregating targets, membrane proteins)
Limitations
- ΔTm ≠ KD — you cannot extract an affinity constant from ΔTm alone
- Negative ΔTm (destabilization) can also indicate binding
- Irreversible unfolding makes ΔTm scan-rate dependent
- Multiple ligands with different mechanisms can give similar ΔTm
For higher throughput thermal shift screening, see TSA/DSF (Thermal Shift Assay) which uses fluorescent dyes in qPCR plates — same principle, 384-well format.
When NOT to Use CD
❌ For binding kinetics
CD measures structure, not binding kinetics. No k_a, k_d, or K_D. Use SPR, BLI, or MST for interaction analysis.
❌ For quantitative structure analysis of IDPs
IDPs give spectra dominated by random coil / PPII signal. CD can confirm disorder and detect residual secondary structure (e.g., transient helicity), but quantitative deconvolution is unreliable — the basis spectra are derived from ordered proteins and don't apply to disordered ensembles.
❌ For membrane proteins in detergent
Many detergents absorb strongly below 200 nm, masking the far-UV CD signal. Use low-absorbance, non-denaturing detergents (DDM, LDAO, CHAPS) — avoid SDS, which is denaturing — or synchrotron CD (SRCD) for extended wavelength range.
❌ When concentration is uncertain
Concentration errors propagate directly into [θ]_MRE. A 20% error in concentration = 20% error in secondary structure estimates. Always verify by A280 or quantitative amino acid analysis.
❌ For protein mixtures
CD reports a composite spectrum of all proteins in the cuvette. Deconvolution assumes a single protein — mixtures give nonsensical secondary structure percentages.
❌ Below ~200 nm without N₂ purging
Atmospheric O₂ becomes appreciable by ~195 nm and the deep-UV lamp generates ozone, both of which create artifacts and destroy signal quality. Purge with dry N₂ (or use vacuum UV / SRCD) for data below ~200 nm.
Publication Checklist
Sample & Instrument
- ☐Buffer blank subtracted
- ☐Concentration method and accuracy stated
- ☐Path length stated
- ☐N₂ purging used (essential below ~200 nm)
- ☐Bandwidth stated (typically 1 nm)
- ☐Scan speed and response time / DIT stated
- ☐Number of accumulations / scans reported
- ☐Temperature controlled and reported
- ☐Instrument make and model stated
Data Quality
- ☐[θ]_MRE or Δε reported (not raw mdeg)
- ☐HT / dynode voltage below instrument-specific threshold (consult manual — data where HT exceeds limit is unreliable)
- ☐Spectrum shown to at least 200 nm (190 nm preferred)
- ☐Deconvolution method stated (CONTIN, SELCON3, CDSSTR)
- ☐Reference dataset stated (SP175, SMP180, etc.)
- ☐NRMSD or goodness-of-fit reported
Thermal Melts
- ☐Monitoring wavelength stated (222 or 208 nm)
- ☐Scan rate stated (°C/min)
- ☐Heating and cooling curves shown (reversibility check)
- ☐T_m extraction method stated (midpoint, derivative, or fit)
- ☐Fitting model stated (two-state, Boltzmann, etc.)
- ☐For ΔT_m: apo and +ligand runs on same day, same protein batch
Instruments using CD
Applied Photophysics Chirascan, Jasco J-series (J-1500, J-1700), Aviv, Olis DSM
Have SPR or BLI data?
Upload your raw files and get an automated kinetic analysis in minutes. We support Biacore, Octet, and other major formats.
Upload & Analyze