🌊 FIDA — Flow-Induced Dispersion Analysis
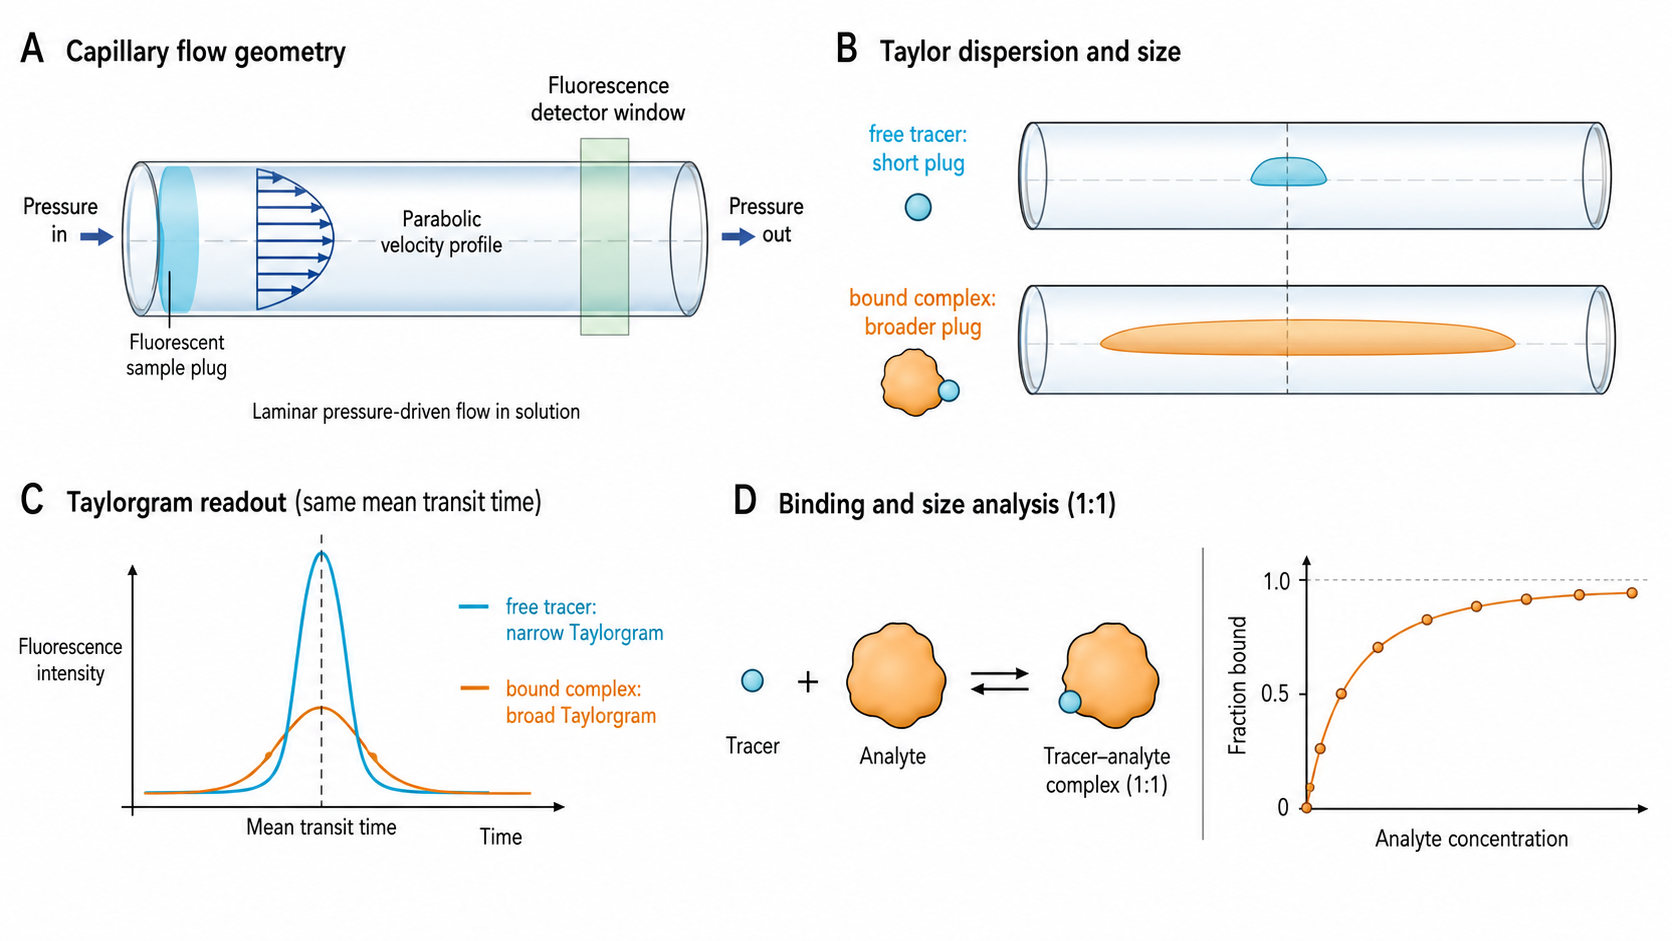
Flow-Induced Dispersion Analysis (FIDA) measures the hydrodynamic radius (R_h) of molecules by exploiting Taylor dispersion — the broadening of a sample plug as it flows through a capillary under laminar conditions. A narrow pulse of fluorescent sample is injected into a capillary. The parabolic flow profile causes molecules near the center to move faster than those near the wall. Diffusion counteracts this spreading. The balance between convective stretching and diffusive mixing determines the shape of the resulting "taylorgram" — and this shape directly encodes the diffusion coefficient, and thus R_h.
In-solution measurement
No surface, no immobilization, and matrix-tolerant readout. Measure in serum, lysate, or formulation buffer.
Absolute R_h
From first principles (Stokes-Einstein) — not relative to standards.
K_D from size change
When analyte binds to a fluorescent indicator, R_h increases → taylorgram broadens → fit the binding isotherm.
Crude matrices
Only the fluorescent species is detected — everything else is invisible. K_D in 100% serum? No problem.
Concentration measurement
Peak area can quantify the fluorescent species with suitable calibration and brightness controls. (Not covered in the simulator below — size measurement only.)
Key Physics Concepts
🌊 The Taylorgram
- Fluorescence intensity vs. time at the detector as the dispersed plug passes
- Shape: approximately Gaussian, with width (σ_t) that encodes the diffusion coefficient
- In the Taylor regime: σ_t² ≈ r²·t_r / (24·D)
- σ_t ∝ √R_h — wider peak = larger molecule
🔗 Binding from Size Change
- Indicator assay: label one partner with a fluorophore. Titrate unlabeled analyte
- Observed R_h varies monotonically with fraction bound → fit R_h,obs vs. [analyte] to a 1:1 binding isotherm to extract K_D
- ΔR_h of a few % is resolvable with replicates; >10% is comfortable
⚡ The Péclet Number
- Pe = v·r/D — convective vs. diffusive transport
- Pe ≫ 1 (Taylor regime): Convection dominates. Enhanced dispersion. FIDA operates here
- Pe ≲ √48 ≈ 7: Convective enhancement r²v²/(48D) is no larger than molecular diffusion itself (D_eff = D(1 + Pe²/48), so the Taylor term equals D when Pe² = 48). At Pe ≈ 1 it is only ~2 % of D. The R_h-dependent component of σ_t is buried under axial diffusion and injection band-width, so sensitivity to R_h collapses — the theory still applies, but the signal you care about is gone
- Typical FIDA operating range: Pe ≈ 500–2000 (see optimization box below)
Interactive Simulator
How FIDA Works — Practical Guide
🔬 Experimental Setup
- Instrument: Fida Neo (Fida Biosystems, current flagship) or Fida 1. Capillary-based fluorescence detection. Fida Neo: fixed 4-LED block (280, 480, 535, 640 nm). Fida 1: swappable LED modules (e.g. 280, 405, 488, 633 nm)
- Capillary: Fused silica, coated (PEG or HEC). Inner diameter ~75 µm, ~1 m total length (~85 cm to the detector). Replaceable cartridge
- Indicator: Fluorescently labeled binding partner. Typical: 1–100 nM (fluorophore-dependent). Should be monodisperse; R_h,free is measured from the zero-analyte run
- Analyte: Unlabeled. Any matrix: buffer, serum, lysate. Serial dilution (8–12 points spanning 0.1–100× K_D). As little as 4 µL per vial
- Run: Inject indicator with each [analyte]. Typical run: ~3–6 min. Full titration: 30–60 min
- Wash: Flush capillary between runs. Coated capillaries minimize carry-over
📊 Data Analysis
- Fit taylorgram: Gaussian fit to each trace → extract σ_t
- Calculate D: D = r²·t_r/(24·σ_t²) for each run
- Calculate R_h: R_h = k_B·T/(6π·η·D)
- Binding curve: Plot R_h,obs vs. [analyte]
- Fit isotherm: 1:1 binding model → K_D, R_h,free, R_h,bound
- Quality check: Residuals, R², ΔR_h signal, Péclet number
🌊 FIDA vs 📊 DLS — Different Routes to R_h
Both measure R_h. The physics is completely different.
| FIDA | DLS | |
|---|---|---|
| What's measured | Temporal broadening of a plug | Intensity fluctuations (Brownian motion) |
| R_h from | Peak width → D → R_h | Autocorrelation → D → R_h |
| Resolution | Single R_h per run (ensemble) | Distribution (z-average + PDI) |
| Sample | 4–50 µL vial, 10–100 nM, labeled | 20–60 µL, 0.1–10 mg/mL, label-free |
| Matrices | Any (serum, lysate) | Best in clean buffers; struggles with crude matrices |
| K_D? | Yes (indicator assay) | Indirect only (not a primary K_D method) |
| Best for | K_D in crude matrices | Quick R_h / polydispersity |
⚡ Getting the Péclet Number Right
- Pe < 10: Convective enhancement is small compared to molecular diffusion, so peak width is dominated by injection geometry and longitudinal diffusion rather than R_h — sensitivity is poor (the theory is still valid, the signal isn't). Increase flow rate or use a larger capillary
- Pe 10–100: Marginal. Results may have higher error
- Pe > 100: Good. Taylor regime established
- Pe > 5000: Deep Taylor regime. If from large R_h, peaks may be very broad — ensure σ_t < t_r/3 for clean fits
Key Quantities
| Quantity | Symbol | Typical range | What it tells you |
|---|---|---|---|
| Hydrodynamic radius | R_h | 0.5–500 nm | Size of molecule or complex |
| Diffusion coefficient | D | 10⁻¹¹ – 10⁻⁹ m²/s | Molecular mobility |
| Péclet number | Pe | 500–2000 (optimal); >100 acceptable | Taylor regime quality |
| Dissociation constant | K_D | ~10 pM – 1 mM | Binding affinity |
| Size change | ΔR_h | ~5% resolvable; >10% comfortable | Signal quality |
| Residence time | t_r | ~120–300 s (2–5 min run) | Time to detector at given flow |
| Peak width (temporal SD) | σ_t | 5–60 s (proteins: 10–40 s); keep σ_t < t_r/3 | Peak width → D |
| Indicator concentration | [I] | 10–100 nM | Fluorescent probe amount |
Common Pitfalls
Adsorption to capillary
Uncoated silica adsorbs charged proteins → tailing peaks, signal loss. Use coated capillaries (PEG, hydroxyethyl cellulose).
Péclet too low
Pe < 10 → no meaningful dispersion. Increase flow rate or use longer capillary.
Indicator too concentrated
[I] ≫ K_D → indicator depletes analyte → right-shifted isotherm. Keep [I] ≤ K_D/10 when possible. When [I] is not ≪ K_D, use the exact quadratic (tight-binding) equation rather than the simple hyperbolic isotherm.
ΔR_h too small
Below a few % change, size shift competes with run-to-run noise. Rule of thumb: comfortable above ~10%; achievable near ~5% with replicates; very small ligands on large proteins are the hard case.
Air bubbles
Capillary sensitive to bubbles → spikes, flow interruption. Degas solutions and prime carefully.
Wrong viscosity
η for serum ≈ 1.2× water. Using water viscosity → ~20% error in R_h. Measure or look up matrix viscosity.
Temperature drift
Water viscosity changes ~2.5%/°C around 25°C, so a 4°C drift gives a ~10% error in R_h. Use the instrument's thermostat and report T explicitly.
Matrix fluorescence effects
Crude matrices can quench fluorescence or shift fluorophore brightness on binding (e.g. HSA binding of cyanine dyes). If the indicator's quantum yield depends on local environment, the binding curve is biased — check for brightness changes via the integrated peak area across the titration.
Non-1:1 binding
Simple isotherm assumes 1:1. Cooperative or multi-site binding needs more complex models.
Photobleaching
High LED intensity + slow flow → signal decay along the taylorgram. Reduce intensity or increase flow.
Strengths & Limitations
✅ Strengths
- • In-solution — no surface artifacts
- • Works in crude matrices: serum, lysate, cell supernatant
- • Absolute R_h from first principles (given known capillary geometry and matrix viscosity)
- • K_D + R_h from the same experiment
- • Very low sample consumption (~40 nL injected; 4–50 µL in the vial)
- • No surface mass-transport limitations (unlike SPR)
- • Measures in formulation buffer → directly relevant to drug product
⚠️ Limitations
- • Requires fluorescent label on one partner (or intrinsic Trp via 280 nm LED)
- • Detection typically from low nM (sub-nM achievable with bright dyes)
- • ΔR_h must be resolvable — challenging for small ligands on very large proteins
- • Single instrument vendor (Fida Biosystems)
- • Lower throughput than MST or DLS (~3–6 min/point)
- • Instrument spec: K_D ~10 pM – 1 mM (practical range narrower, limited by ΔR_h and [I])
- • Membrane proteins in detergent micelles are challenging (micelle dominates R_h)
When NOT to Use FIDA
Small molecule → large protein
500 Da binding to 150 kDa changes R_h by <1%. Use MST, ITC, or SPR.
Very tight binders (K_D ≪ [indicator])
If you cannot lower [indicator] below K_D, the titration saturates early and K_D is bounded, not resolved. Use SPR for sub-pM affinities.
Fast kinetics (k_off ≫ 0.1 s⁻¹)
FIDA is primarily an equilibrium method; slow kinetics can be extracted from time-resolved runs, but fast k_on/k_off is SPR/BLI territory.
Membrane proteins (caveats)
Detergent micelles dominate the R_h signal and can adsorb to the capillary. Nanodiscs and mild detergents have been used successfully in the literature — expect it to be more work than a soluble protein.
No fluorescent label available
Intrinsic Trp fluorescence is weak. Use DLS or AUC for label-free sizing.
High-throughput screening
30–60 min per K_D. For thousands of compounds, use SPR/BLI or TR-FRET.
Technique Comparison
| 🌊 FIDA | 📡 SPR | 🌡️ MST | 📊 DLS | |
|---|---|---|---|---|
| Format | In-solution (capillary) | Surface-based (chip) | In-solution (capillary) | In-solution (cuvette) |
| Output | R_h + K_D | k_on, k_off, K_D | K_D | R_h only |
| Label | Fluorescent | Label-free | Fluorescent | Label-free |
| Matrices | Serum, lysate | Clean buffer | Some tolerance | Clean buffer |
| K_D range | pM – mM (instrument spec) | pM – mM | pM – mM | N/A |
| Best for | K_D in crude matrices | Kinetics | Screening K_D | Quick R_h/PDI |
Publication Checklist
🔬 Experimental
- ☐ Instrument and version stated
- ☐ Capillary type, coating, and dimensions
- ☐ Indicator identity and labeling method
- ☐ Indicator concentration
- ☐ Analyte concentration range (≥8 points)
- ☐ Buffer/matrix composition
- ☐ Flow rate and temperature
- ☐ Number of replicates
📊 Analysis
- ☐ Taylorgram fit quality (residuals, R²)
- ☐ Péclet number reported
- ☐ R_h,free and R_h,bound ± SD
- ☐ K_D ± SD or CI
- ☐ Binding model stated (1:1, etc.)
- ☐ ΔR_h/R_h,free reported
- ☐ Viscosity stated if non-water matrix
- ☐ Controls (indicator alone, buffer blank)
🔧 Instruments & Software
Instruments
- Fida Neo (Fida Biosystems) — current flagship. 4-LED excitation (280 nm for intrinsic Trp, 480 nm, 535 nm, 640 nm), automated plate handling, temperature control. Measures K_D (~10 pM – 1 mM), R_h (0.5–500 nm), and additional biophysical parameters
- Fida 1 (Fida Biosystems) — previous-generation commercial instrument, still widely used. Swappable LED modules (e.g., 280, 405, 488, 633 nm) rather than a fixed 4-LED block
- Custom setups — Academic labs using HPLC capillaries + UV/fluorescence detectors (not standardized)
Software
- Fida Biosystems — Integrated taylorgram fitting, R_h calculation, binding isotherm fitting
- Custom scripts — Python/MATLAB for non-Gaussian fits, multi-component analysis
Have SPR or BLI data?
Upload your raw files and get an automated kinetic analysis in minutes. We support Biacore, Octet, and other major formats.
Upload & Analyze