🧪 HDX-MS — Hydrogen-Deuterium Exchange Mass Spectrometry
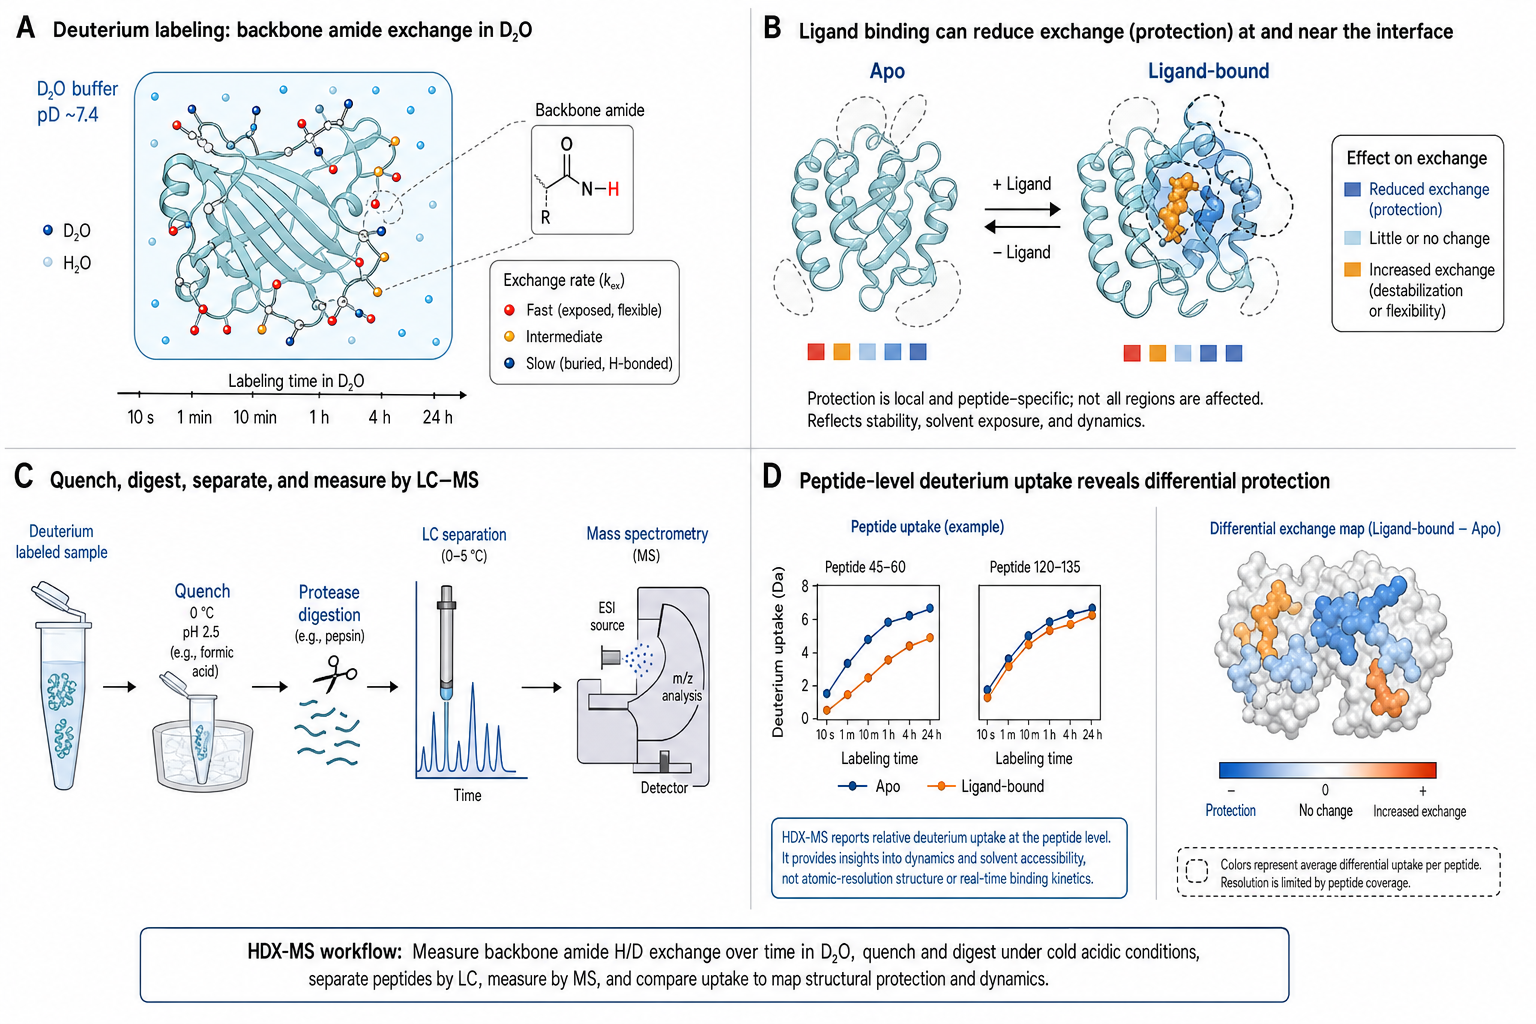
Hydrogen-Deuterium Exchange Mass Spectrometry (HDX-MS) probes protein conformational dynamics by measuring the rate at which backbone amide hydrogens exchange with deuterium from D₂O solvent. When a protein is diluted into D₂O, exposed and flexible amide N-H groups exchange rapidly, while those buried in the hydrophobic core or involved in stable hydrogen bonds exchange slowly. After a controlled labeling time, the exchange is quenched (low pH, low temperature), the protein is digested into peptides by pepsin, and the peptides are analyzed by LC-MS. The mass increase of each peptide — typically 1 Da per exchanged hydrogen — reveals how much deuterium was incorporated, and thus how exposed or dynamic that region of the protein was during the labeling period.
HDX-MS is uniquely powerful for studying conformational dynamics under near-native conditions. Unlike X-ray crystallography (static, crystal-packing artifacts) or cryo-EM (vitrified snapshots, limited to resolvable conformational states), HDX-MS captures the time-averaged conformational ensemble in solution — at physiological pH, temperature, and buffer. It detects changes in protein flexibility and solvent exposure upon ligand binding (epitope mapping), allosteric transitions, aggregation, and post-translational modifications. The technique provides peptide-level spatial resolution (typically 5–15 residues per peptide) and time resolution from seconds to hours.
Conformational dynamics in solution
No crystal, no vitrification, no extrinsic label. The protein is in its native ensemble — D₂O is the only perturbation (ΔΔG < 0.5 kcal/mol).
Peptide-level structural resolution
Map which regions open, close, or restructure upon binding or mutation. Typically 5–15 residues per peptide.
Gold-standard epitope mapping
The premier solution-phase method. See which peptides become protected when an antibody binds.
Comparability / biosimilar assessment
Compare higher-order structure (HOS) of biotherapeutics lot-to-lot or originator-vs-biosimilar. Regulatory accepted.
Broad applicability
Works for soluble proteins, membrane proteins in nanodiscs, antibodies, large complexes (up to MDa).
Key Physics Concepts
⚗️ Intrinsic Exchange Rate
- k_ch = k_A[H⁺] + k_B[OH⁻] + k_W
- At pH 7, 25°C: k_ch ≈ 0.1–10 s⁻¹ depending on sequence (t½ ≈ 0.1–10 s). The water-catalysed term k_W is small except near the pH minimum
- V-shaped pH profile — minimum near pH 2.5–3.0 (H₂O) or pD ≈ 3.0 (D₂O, shifted by ~+0.4)
- This minimum is the basis for the quench step (pH 2.5, 0°C): back-exchange slows ~10⁵-fold
🛡️ Protection Factors
- In EX2: k_ex = k_ch / PF
- PF = 1: fully exposed (disordered loops, termini)
- PF = 10–100: transiently exposed (surface loops)
- PF = 10³–10⁵: well-protected (stable core helices/sheets)
- PF > 10⁶: very stable core (rarely opens)
- ΔG_op = RT ln(PF) — free energy of local opening
🔄 The Workflow
- Label: Dilute protein into D₂O (≥90%). Incubate 10 s – 4 h
- Quench: pH 2.5, 0°C — slows exchange ~10⁵-fold
- Digest: Pepsin (acid-active protease) at 0°C, 2–5 min
- LC-MS: Rapid RP-HPLC at 0°C → ESI-MS (<10 min)
- Analyze: Centroid mass shift = deuterium uptake per peptide
Interactive Simulator
k_ch vs. pH (at 25 °C)
k_ch vs. Temperature (at pH 7.0)
How HDX-MS Works — Practical Guide
🔬 Experimental Workflow
- Protein preparation: 5–50 µM in H₂O buffer. Must be monodisperse
- Deuterium labeling: ≥10-fold dilution into D₂O buffer (pD = pH_read + 0.40). Time points: 10 s, 1 min, 10 min, 1 h, 4 h
- Quench: Equal volume 200 mM phosphate pH 2.2 at 0°C → final pH 2.5 ± 0.1
- Digestion: Online immobilized pepsin column at 0°C (2–5 min)
- LC-MS: Rapid RP separation at 0°C → ESI-MS. 5–40% ACN in 5–10 min
- Controls: Undeuterated (H₂O) + fully deuterated (D₂O + denaturant) to bracket uptake scale
📊 Data Analysis
- Peptide identification: MS/MS on undeuterated sample → 85–98% coverage, 3–8× redundancy
- Centroid mass: Compute centroid of isotopic envelope at each time point. Shift = deuterium uptake (Da)
- Uptake plots: D(t) vs. time for each peptide → fit to sum of exponentials
- Differential analysis: ΔD = D_B − D_A per peptide. Use the Houde 98% confidence interval or the Hageman & Weis (2019) hybrid test (combined ΔD threshold + Welch's t-test) for significance
- Visualization: Heat maps, butterfly/mirror plots, Woods plots, structural mapping (PDB coloring)
- Back-exchange correction: D_corr = (m_sample − m_0%) / (m_100% − m_0%) × N_amides
EX1 vs. EX2 — Two Regimes of Exchange
Same chemistry. Different structural dynamics. Completely different isotopic envelopes.
| EX2 (common) | EX1 (rare, cooperative) | |
|---|---|---|
| Condition | k_cl ≫ k_ch (fast refolding) | k_ch ≫ k_cl (slow refolding) |
| k_ex | k_ch / PF | ≈ k_op |
| Isotopic envelope | Gradual centroid shift | Bimodal distribution |
| What it means | Many small openings → partial exchange each time | One cooperative opening → full exchange |
| When observed | Most proteins, native conditions | Cooperative unfolding, molten globule, high pH/T |
| Identification | Centroid analysis sufficient | Must examine isotopic envelope (width, bimodality) |
| Structural info | PF per amide → local stability at each site | Cooperatively unfolding units → folding intermediates |
⚠️ Back-Exchange — The Unavoidable Artifact
Every HDX-MS measurement loses deuterium. Quantify and correct for it — or your data is wrong.
- Source: During quench, digestion, and LC separation (H₂O solvent), deuterium exchanges back. Side-chain deuterium is lost completely
- Magnitude: Typically 15–30% of incorporated backbone deuterium is lost
- Correction: Use fully deuterated control: D_corr = (m − m_0%) / (m_100% − m_0%) × N_max
- Minimization: LC at 0°C, short gradients (<10 min), minimize dead volume, use UPLC
- Caveat on the m_100% control: A true "fully deuterated" (maximally labelled) reference is hard to achieve — even in 6 M GdmCl at high temperature some proteins do not fully unfold, so m_100% is underestimated and the correction over-compensates
- Critical case: Highly protected amides with ~2 Da uptake can lose 0.4 Da (20%) — potentially below significance threshold
Key Quantities
| Quantity | Symbol | Typical range | What it tells you |
|---|---|---|---|
| Intrinsic exchange rate | k_ch | 0.1–10 s⁻¹ (pH 7, 25°C) | Unprotected chemical exchange rate |
| Protection factor | PF | 1–10⁸ (≈10⁶ typical EX2 ceiling before global unfolding dominates) | Structural protection of an amide |
| Opening free energy | ΔG_op | 0–12 kcal/mol | Local structural stability |
| Deuterium uptake | D(t) | 0–N Da | Mass shift = # exchanged amides |
| Back-exchange | % loss | 15–30% | Deuterium lost during workup |
| Sequence coverage | % | 85–98% | Protein observed as peptides |
| Spatial resolution | residues/peptide | 5–15 | Granularity of structural info |
| Labeling times | t | 10 s – 4 h | Time range of exchange kinetics |
| Significance threshold | ΔD | 0.5–1.0 Da (Houde 98% CI / Hageman-Weis hybrid) | Minimum difference to call significant |
| Redundancy | overlap | 3–8× | Enables sublocalization |
Common Pitfalls
Inadequate quench
pH not low enough or temperature not cold enough → exchange continues during analysis. Always verify: pH 2.5 ± 0.1, 0°C.
Excessive back-exchange
LC column too warm, gradient too long, large dead volume. Keep column at 0–4°C, gradients <10 min. Always run fully deuterated control.
Carry-over between injections
Pepsin column retains fragments → deuterated peptides in subsequent runs. Run blank injections between samples.
Ignoring pD correction
Glass electrode reads 0.40 units lower in D₂O. If you set pH_read 7.0, actual pD = 7.4. Set pH_read = pD_target − 0.40.
Too few time points
A single time point cannot distinguish fast-few from slow-many exchangers. Use ≥4 time points spanning ≥3 decades.
No back-exchange correction
Raw centroid shifts systematically underestimate true uptake. Always correct using 0% and 100% controls.
Confusing EX2 with EX1
Fast centroid shift can mimic EX1 at the centroid level. True EX1 requires examining isotopic envelope shape for bimodality.
Low coverage in key regions
Pepsin cleavage is protein-dependent. Some regions (transmembrane, heavily glycosylated) may yield no peptides. Check coverage maps.
Strengths & Limitations
✅ Strengths
- • Solution-phase conformational dynamics — no crystal, no label, no cross-linking
- • Peptide-level resolution (~5–15 residues) across the entire protein
- • Any size: peptides (1 kDa) to large complexes (MDa)
- • Gold-standard epitope mapping without crystal structures
- • Detects allosteric changes distal from binding site
- • Comparability assessment for biotherapeutics (HOS, regulatory accepted)
- • Works with membrane proteins in nanodiscs or micelles
- • Quantitative: PF → ΔG_op for each segment
⚠️ Limitations
- • Resolution limited to peptide-level without ECD/ETD fragmentation
- • Back-exchange (15–30%) is unavoidable, reduces sensitivity
- • Requires ~0.5–5 mg protein total (10–50 µg × 5–7 time points × replicates)
- • Not high-throughput: full experiment takes 1–2 days
- • Does not directly measure ligand association/dissociation rates (k_on/k_off) — for those use SPR/BLI/stopped-flow
- • Cannot detect side-chain-only rearrangements
- • Pepsin digestion is protein-dependent: coverage varies
- • Complex analysis: requires specialized software and expert interpretation
When NOT to Use HDX-MS
Need single-residue resolution
HDX-MS gives 5–15 residue resolution. For single-residue info, use NMR (CSP, relaxation) or ETD/ECD fragmentation.
Need binding kinetics (k_on, k_off)
HDX-MS measures equilibrium dynamics, not binding rates. Use SPR, BLI, or stopped-flow.
High-throughput screening
Full experiment takes 1–2 days. For 1000 compounds, use SPR/BLI, DSF/TSA, or functional assays.
Protein is scarce (<0.5 mg)
Each experiment consumes 0.5–5 mg. If limited, consider NMR (if small) or cross-linking MS.
Side-chain interactions only
HDX-MS monitors backbone amides. Side-chain rearrangements without backbone change are invisible. Use NMR or MD.
Intrinsically disordered protein
Fully disordered proteins exchange at intrinsic rates (PF ≈ 1) — uninformative. Use NMR relaxation or SAXS.
Technique Comparison
| 🧪 HDX-MS | 🧲 NMR | 🔗 XL-MS | 🧊 Cryo-EM | |
|---|---|---|---|---|
| What's measured | Backbone amide exchange | Chemical shifts, NOEs, relaxation | Cross-linked residue pairs | Direct structure imaging |
| Resolution | Peptide-level (5–15 res) | Single-residue | Residue-pair level | Near-atomic (2–4 Å) |
| Conditions | Solution, native | Solution, native | Solution → cross-link → MS | Vitrified, flash-frozen |
| Size range | kDa to MDa | <40 kDa routine | Any size | >100 kDa preferred |
| Protein needed | 0.5–5 mg | 5–50 mg, isotope-labeled | 10–100 µg | 0.1–1 mg |
| Best for | Epitope mapping, HOS comparison | Detailed dynamics, small proteins | Interactome, large complexes | High-res structures |
Publication Checklist
🔬 Experimental
- ☐ Protein construct, concentration, and buffer stated
- ☐ D₂O labeling conditions: pD (with pD_read + 0.40 correction), temperature, %D₂O
- ☐ Labeling time points (≥4, spanning ≥3 decades)
- ☐ Quench conditions (pH 2.5, 0°C)
- ☐ Pepsin digestion method (online/offline, ratio, time)
- ☐ LC conditions (column, temperature, gradient, flow rate)
- ☐ MS instrument and settings
- ☐ Replicates per condition (≥3)
- ☐ Sequence coverage (%) and redundancy
- ☐ Back-exchange (%) from fully deuterated control
📊 Analysis
- ☐ Software and version stated
- ☐ Centroid calculation method
- ☐ Back-exchange correction applied (yes/no, method)
- ☐ Statistical criteria: ΔD threshold AND p-value
- ☐ Uptake plots for key peptides (not just heat maps)
- ☐ Woods plot or butterfly plot for differential experiments
- ☐ Full peptide list in supplementary materials
- ☐ Structural mapping (if structure available)
- ☐ Follows Masson et al. 2019 community guidelines (Nature Methods)
🔧 Instruments & Software
Instruments
- Waters HDX system (SYNAPT/Xevo + LEAP HDX-2 PAL/TRAMP) — most widely used automated platform. Online pepsin, UPLC at 0°C
- Thermo Fisher (Q Exactive, Orbitrap Exploris + CTC PAL) — high-resolution Orbitrap, excellent mass accuracy
- Bruker (timsTOF + CTC PAL) — ion mobility adds extra separation dimension (TIMS)
- Manual setups — hand labeling/quench onto any LC-MS. Lower throughput, higher variability
Software
- HDExaminer (Sierra Analytics) — automated peak detection, centroid calculation, butterfly plots. Most user-friendly
- DynamX (Waters) — integrated with Waters hardware. Robust peptide mapping and uptake analysis
- HDX-Workbench (Pascal et al.) — free/academic, scriptable, built-in statistical framework
- DECA / ExMS / HX-Express / HDXBoxeR — academic tools for sublocalization, EX1 detection, bimodal fitting, and statistical analysis
Have SPR or BLI data?
Upload your raw files and get an automated kinetic analysis in minutes. We support Biacore, Octet, and other major formats.
Upload & Analyze