🧫 LigandTracer — Real-Time Binding on Adherent Cells
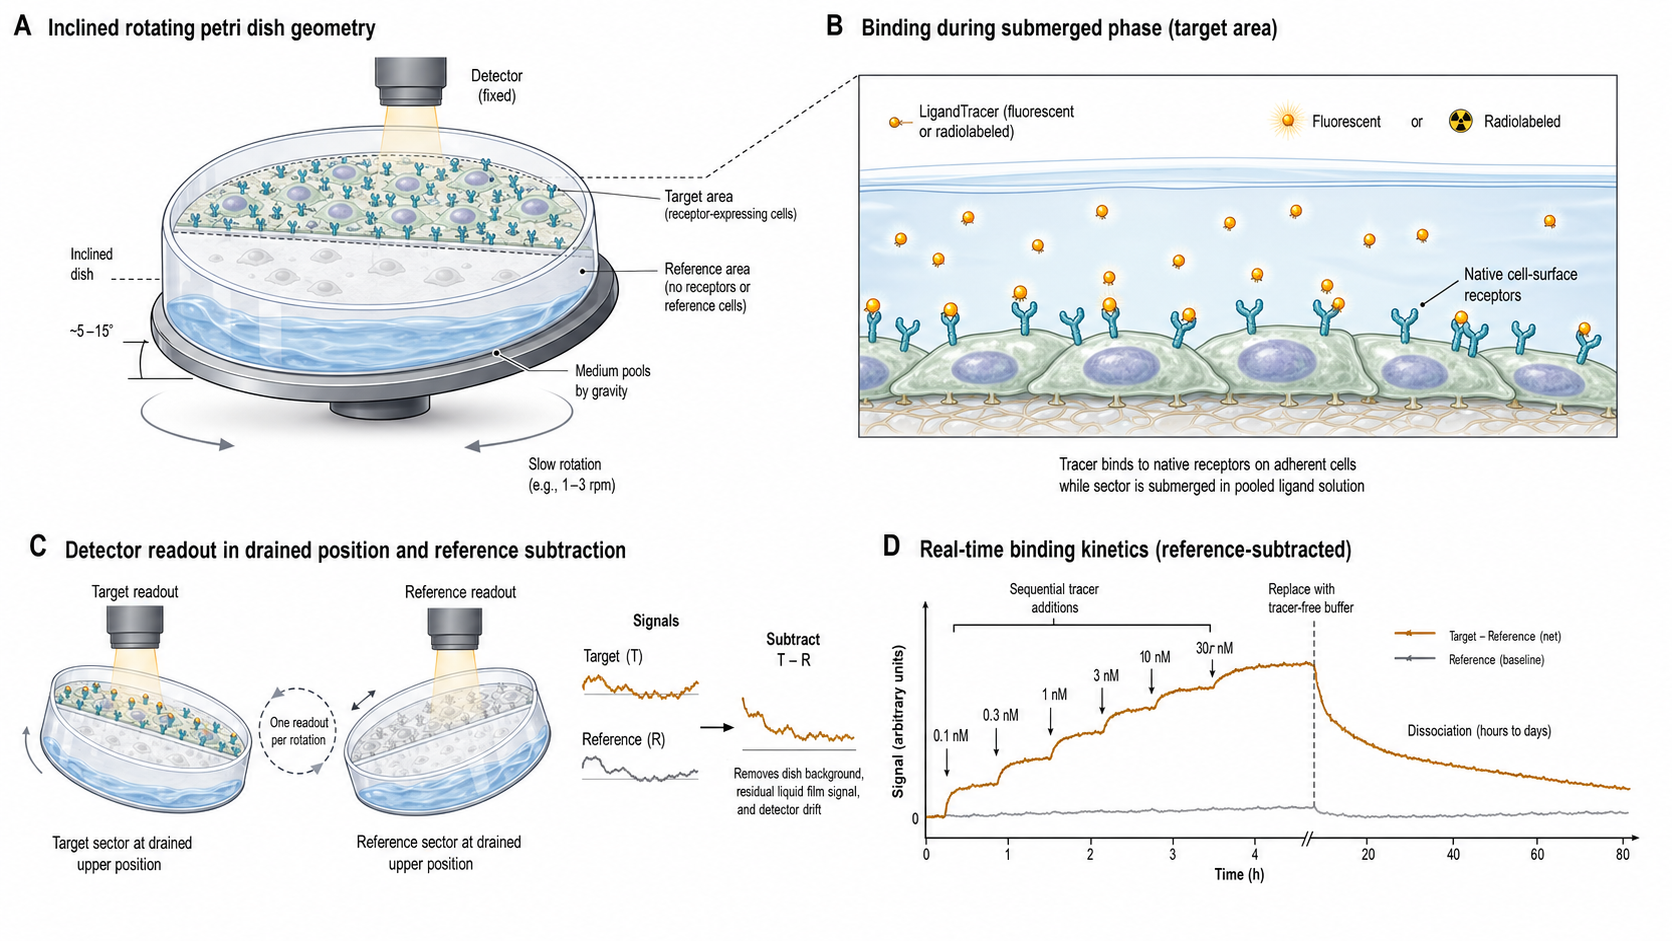
LigandTracer (Ridgeview Instruments, Uppsala) is a "rotating RIA" for live cells: a standard petri dish is mounted on an inclined, slowly rotating stage, and a detector is fixed above the elevated edge of the dish. Adherent cells occupy a defined area on the bottom of the dish (a separate cell-free or non-target-cell reference area lies on the opposite side). Because the dish is tilted, the medium with the labelled ligand pools at the lower edge — so each rotation the cells are alternately submerged in the ligand bath (where most binding happens) and lifted to the upper, drained position where the detector reads them. The signal in the upper position is dominated by tracer that has actually accumulated on or in the cells; bulk free ligand stays at the bottom and is largely outside the detection volume.
A reference area (cell-free, or seeded with non-target cells) elsewhere on the same dish is read once per rotation as well, and subtracted from the target area. This removes dish autofluorescence/background counts, any residual tracer film in the upper position, and slow detector drift. The result is a real-time trace of bound ligand vs. time, sampled about once per minute (one full rotation), over hours or days.
The four models — Green / Yellow / Grey / White (see "Four detector families" below) — share this geometry and only differ in the detector head, which is matched to the tracer: a PMT-based optical unit for fluorescence, a scintillator for high- and low-energy γ/X-ray photons, and a particle-counting unit for β emitters.
Native adherent cells
Standard ~100 mm Petri dish (87–89 mm Ø, e.g. Nunc #150350) or the LigandTracer MultiDish 2×2. No immobilisation, no purification — receptors stay in their physiological membrane environment.
Hours to days timescale
A 24 h run is routine; multi-day runs are possible. Off-rates with τ of many hours are routine — well below the SPR/BLI floor — which is why slow-off antibodies and radioligands are LigandTracer's home turf.
Radioligand-ready
Three radiation models (Yellow / Grey / White) cover PET/SPECT isotopes, ¹²⁵I, and β emitters — the gold standard for GPCR and nuclear-receptor pharmacology.
Self-referenced in one dish
A cell-free or non-target-cell area on the same dish is read once per rotation and subtracted — cancelling autofluorescence, residual film background, and slow drift.
Step-titration in one run
Sequentially add concentrations C₁, C₂, … wait for each plateau, then dissociate. One run yields both kinetics and the equilibrium isotherm — the standard TraceDrawer "OneToOne" / "OneToOneDepletionCorrected" workflow.
Avidity in the cell context
Multivalent ligands engage neighbouring receptors in a native membrane — the K_D returned is the apparent (avidity-enhanced) cell-surface K_D, which is usually what matters in vivo.
How the measurement works
1. Inclined, rotating dish
The dish sits on an inclined, motorised support. Medium pools at the lower edge by gravity; cells are adherent in defined areas — a target area expressing the receptor and a reference area that is cell-free (or seeded with non-target cells).
2. Detector reads at the top
A fixed detector is mounted above the upper rim of the support. As the dish rotates, each area passes under the detector once per rotation in the drained upper position — bulk medium is at the bottom and largely outside the detection volume, so the signal is dominated by ligand bound to (or internalised into) the cells.
3. Subtract reference
The reference area is read in the same upper position, with the same drainage and the same detector gain. Subtracting reference from target cancels dish autofluorescence/background counts, any residual liquid film, and PMT/counter drift, leaving only the receptor-specific binding.
4. Add ligand, watch binding
Tracer is added to the medium at a chosen concentration. Binding accumulates over the submerged portion of each rotation and the bound signal is read once per rotation in the drained position. To dissociate, the medium is replaced with tracer-free buffer and the run continues — for hours or days, depending on the off-rate.
Four detector families
| Model | Detects | Typical labels | Typical use |
|---|---|---|---|
| Green | Fluorescence (PMT with interchangeable filter modules) | FITC, Alexa 488/546/594/647, Cy classes — modules from 488/535 nm out to ~632/676 nm | Fluorescently labelled antibodies and proteins on live cells; the workhorse for non-radioactive biology |
| Yellow | High-energy γ-photons (~0.1–1.5 MeV), including 511-keV annihilation photons from β⁺ emitters — scintillator-based | ¹⁸F, ⁵¹Cr, ⁵⁷Co, ⁶⁴Cu, ⁶⁸Ga, ⁸⁹Zr, ⁹⁹ᵐTc, ¹¹¹In, ¹³¹I, ¹⁷⁷Lu, ¹⁸⁸Re, ²¹²Pb | PET/SPECT radionuclide binding; theranostics development |
| Grey | Low-energy γ-photons and X-rays (~10–100 keV) | ¹²⁵I (primary use), and the low-energy X-ray lines of ⁸⁹Zr, ¹¹¹In, ¹⁷⁷Lu | Classical ¹²⁵I radioligand binding for GPCR / nuclear-receptor pharmacology |
| White | β⁺ / β⁻ particles | ³H, ¹⁴C, ¹¹C, ³²P/³³P, ³⁵S, ¹⁸F, ⁶⁴Cu, ⁶⁸Ga, ⁸⁹Zr, ¹¹¹In, ¹²⁴I, ¹⁷⁷Lu, ¹⁸⁸Re, ²²³Ra | β emitters that the γ/X-ray models can't see — ³H is the canonical small-molecule case |
The rotating-dish geometry is identical across all four; only the detector head and its electronics differ. The same TraceDrawer software analyses every dataset.
Physics worth knowing before you fit
LigandTracer curves look superficially like SPR sensorgrams, but four biophysical considerations differ enough to change which model you should pick and how to interpret the result.
Finite-bath ligand depletion
The medium volume is small (~3 mL for a 100 mm Petri dish, 1.8 mL per compartment in a MultiDish 2×2) and the cell population is finite, so a high-affinity tracer can noticeably deplete from the medium as it binds. L_free(t) then drops over time, the apparent approach to equilibrium slows, and a naive pseudo-first-order Langmuir fit returns a spuriously low k_on and inflated K_D. TraceDrawer's OneToOneDepletionCorrected model exists for exactly this case.
Receptor internalisation
Many cell-surface receptors (EGFR, HER2, TfR, somatostatin receptors, …) internalise after ligand binding. The tracer is then inside the cell — still cell-associated and still within the detector's field of view — so the apparent dissociation phase shows little or no decay even when the underlying molecular interaction is fully reversible. The fitted k_off is then an upper bound on the surface k_off, not a measurement of it.
The flip side: LigandTracer is also widely used deliberately to quantify internalisation. Ridgeview's published applications use temperature-shift assays (a 4 °C run suppresses endocytosis and isolates surface binding; a parallel 37 °C run captures binding plus internalisation, and the difference is the internalised pool). For radiotracers, a surface-stripping acid wash applied at intermediate time points provides a complementary discrimination.
Mass transport (no flow)
There is no flow. Tracer reaches the cells by diffusion in the bath; the rotation is slow but provides mild convective mixing. For antibody-sized tracers (D ≈ 4×10⁻¹¹ m²/s) the diffusion time across a ~200 µm unstirred boundary layer is τ ≈ 17 min, on the order of the binding timescale at low-nM concentrations with kon ≈ 10⁵ M⁻¹ s⁻¹. Apparent kon can therefore underestimate the intrinsic value.
For small-molecule radioligands (D ≈ 10⁻⁹ m²/s) the diffusion coefficient is ~25× larger, the equilibration time across the boundary layer drops to tens of seconds, and transport limitation is rarely an issue.
Note that binding itself happens continuously — cells contact ligand both in the submerged portion of the rotation and via the residual film in the upper position — so the standard 1:1 model treats binding as continuous and the detector simply samples B(t) once per rotation.
Photobleaching and isotope decay
For fluorescent tracers (Green), repeated illumination bleaches the dye. Reference subtraction does not rescue this — the bleaching of the cell-associated fluorophore in the target area is exactly the source of an artefactual decay in the bound signal, and the cell-free (or non-target-cell) reference area has no equivalent fluorophore for it to cancel against. The instrument minimises bleaching by reading only briefly per rotation, but long runs (> 12 h) can still show a monotonic droop that masquerades as dissociation. Low-bleach dyes (Alexa Fluor family) and a linear / exponential drift correction in the fit are the standard mitigations.
For radioactivity, decay is deterministic and known. ¹²⁵I (t½ = 59.4 d) loses ~1.2 % over 24 h; ¹⁸F (t½ = 110 min) loses ~32 % per hour and must be decay-corrected; ³H (t½ = 12.3 y) is effectively constant over any run. TraceDrawer can export decay-corrected curves — applying the correction a second time downstream is a silent error to avoid.
Avidity on multivalent receptors
A bivalent IgG that disengages one arm can immediately rebind a neighbouring receptor before fully diffusing away. The apparent koff is then orders of magnitude slower than the monovalent value, and the K_D fitted from such a curve is an apparent K_D for the cell-surface system — usually the biologically relevant number, but not the free-solution monovalent K_D. A bivalent-analyte model (or a monovalent-Fab control) can decompose the avidity contribution.
Signal units are not RU
The signal is fluorescence in arbitrary units (Green) or counts per second / per rotation (Yellow, Grey, White). It is proportional to bound tracer but not natively in molecules-per-cell. Converting to receptors per cell requires a separate calibration — typically a known activity / known concentration standard read on the same instrument. Reports should carry through the instrument-native units rather than mislabelling them "RU".
When LigandTracer is the right tool
Pick LigandTracer for…
- Therapeutic antibody / ADC kinetics on live target cells
- Slow-dissociating binders (τ of hours to days) that SPR/BLI can't baseline within a practical run
- Radioligand binding (¹²⁵I, ³H, PET/SPECT isotopes) for receptor pharmacology and theranostics
- Avidity-dominated systems where the cell-surface K_D is what matters
- Long-timescale studies (hours-to-days), including deliberate internalisation profiling
Look elsewhere for…
- Fast kinetics (half-times comparable to or shorter than the rotation period, ~1 min)
- High-throughput screening — one dish at a time, hours per measurement
- Intrinsic monovalent K_D on a purified target — use SPR / BLI / GCI
- Thermodynamics (ΔH, ΔS) — use ITC
- Single-cell heterogeneity — use heliXcyto or flow-based methods
Analysis support — coming soon
We're building parser and fitting support for LigandTracer datasets (TraceDrawer exports, all four detector families, with proper handling of depletion, internalisation, and instrument-native signal units). Reach out if you run a LigandTracer lab and want anonymised data to seed the parser, or if you'd like to be on the early-access list for the analysis page.
Have SPR or BLI data?
Upload your raw files and get an automated kinetic analysis in minutes. We support Biacore, Octet, and other major formats.
Upload & Analyze