⚡ switchSENSE — Label-Free Surface Kinetics on DNA Nanolevers
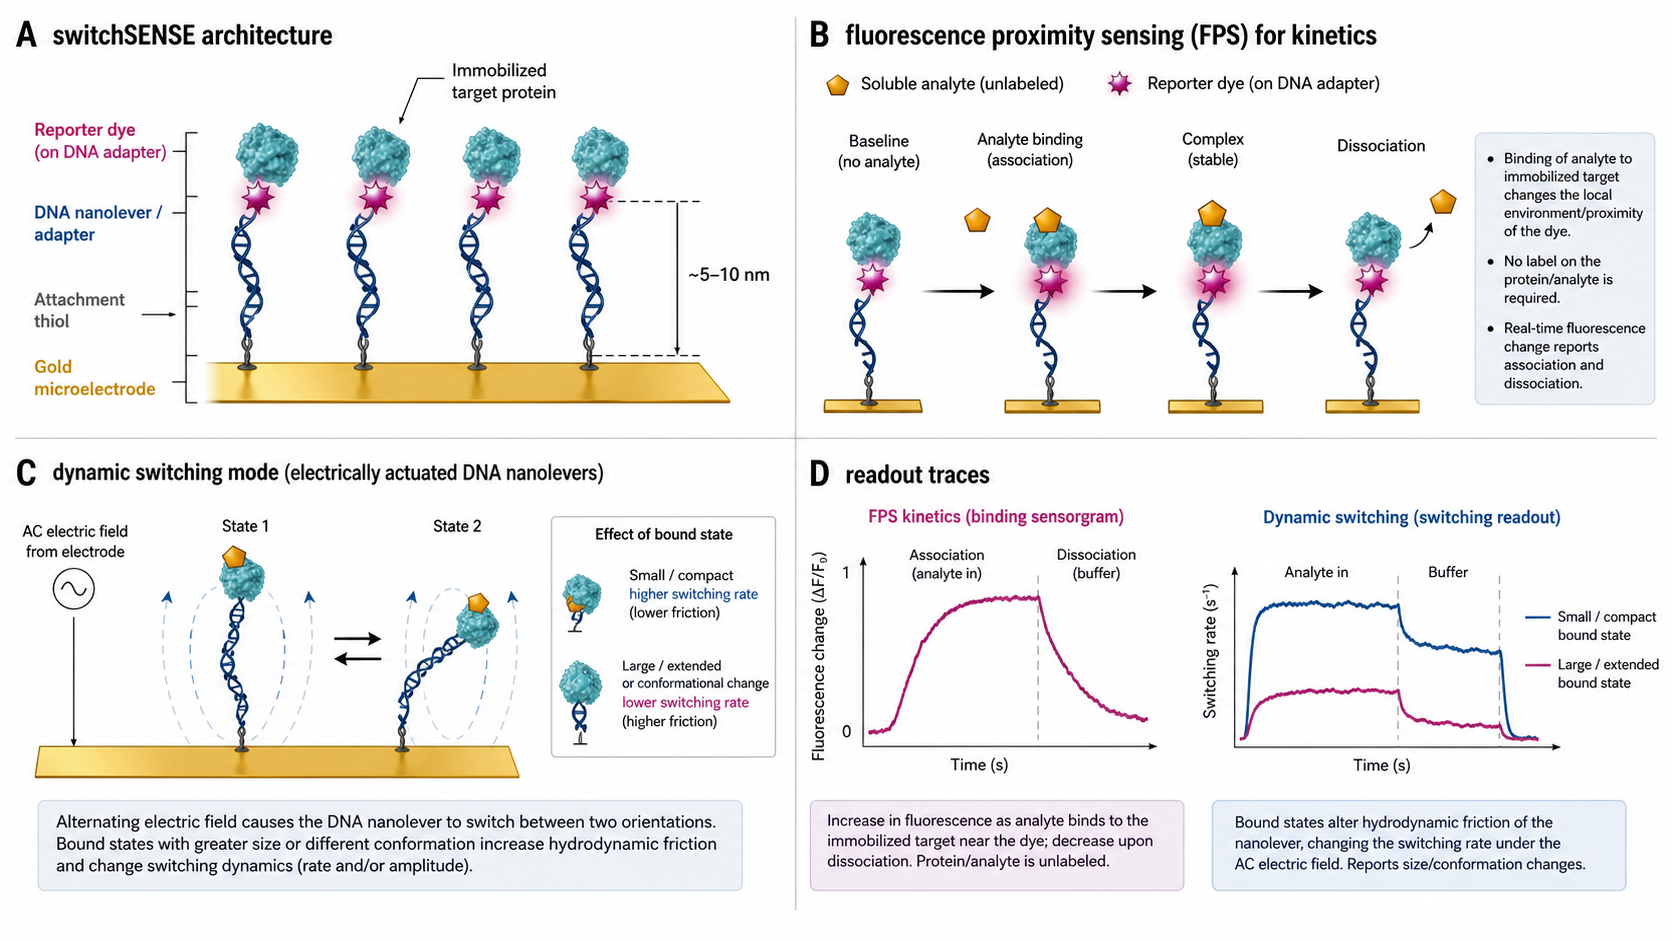
switchSENSE is a label-free surface-kinetics method, measured on a sensor surface like SPR, BLI, or GCI — the reporter dye sits on the DNA adapter strand, not on the target. Where it differs is the detection physics: rather than tracking mass, switchSENSE monitors molecular interactions through changes in fluorescence of the dye attached to the tip of the DNA nanolever, positioned close to the immobilised target — a method known as Fluorescence Proximity Sensing (FPS). In FPS mode the dye sits within reach of its flexible linker of the immobilised target and probes its chemical environment. When an analyte binds, the dye is quenched or anti-quenched by dynamic and static interactions with the protein and the bound species — knock-like collisions, hydrophobic stacking with aromatic moieties, perturbation of the dye's isomerisation state, or intersystem crossings into non-fluorescent triplet states. Tracking dye fluorescence in real time yields a sensorgram and standard kinetic fits — k_on, k_off, K_D.
The platform also offers FRET-based readouts for ternary complex studies (two dyes on independent strands; analyte binding to a labelled partner changes donor–acceptor distance and FRET efficiency), and a dynamic / switching mode where the switching behaviour of an electrically driven DNA nanolever (routinely a 48 bp dsDNA helix; multi-helix DNA-origami bundles in newer chip designs) provides information on conformational changes upon binding. In dynamic mode the protein is attached to the distal end of a long, rigid, slender DNA nanolever; an alternating voltage drives the lever to oscillate, and the upward switching speed is inversely related to the hydrodynamic friction it experiences. Larger or more extended conformations slow the switching, making the mode a sensitive reporter of conformational state rather than mass — what makes the technology genuinely unique among kinetic biosensors.
On the chip, three DNA building blocks form the sensor — a fixed anchor strand tethered to a gold microelectrode (150 µm spot, glass substrate), an exchangeable adapter strand carrying the fluorescent dye, and an exchangeable ligand strand carrying the target. Each chip has one flow channel and two sensor spots; a 5-chip carousel and cross-over microfluidics (20 ms flow switching, 20–500 µL/min) drive automated runs. Detection is by four single-photon counters with electrically-triggered time-correlated single-photon counting (E-TCSPC); photon arrival is timed at ps precision (standard TCSPC), with ~0.1 µs gating / time-bin width used for switching-trace analysis. Dual red (655–685 nm) and green (525–575 nm) channels. The technology was developed by Dynamic Biosensors GmbH (Munich, Germany), acquired by Bruker in October 2024. heliX+ is the current platform; the same surface chemistry also underpins heliXcyto, Bruker's single-cell interaction cytometry platform (covered on its own academy page).
FPS — environment-sensitive readout
A reporter dye on a flexible linker next to the target senses chemical environment changes when an analyte binds. Direct fluorescence sensorgram, no mass dependence.
Kinetics without mass dependence
Signal comes from local dye environment changes, not analyte mass. Small molecules, fragments, and conformational rearrangements are all detectable.
FRET for ternary complexes
Dual-dye configurations report distance between two labelled partners — ideal for cooperativity and ternary-complex studies (PROTACs, molecular glues).
Dynamic mode for conformation
Protein on a long DNA nanolever (dsDNA, or origami in newer chips); electrically driven switching speed reports hydrodynamic friction → conformational state, not just binding.
Oriented, homogeneous surface
DNA nanolevers position the target 16–33 nm above the gold electrode, away from non-specific interactions.
Regeneration-friendly
DNA nanolevers can be denatured and re-hybridised fresh for each experiment cycle.
Key Physics Concepts
⚡ Dynamic-Mode Switching Physics
Applies to dynamic-SET mode only. FPS / FRET use the same surface but a different readout (fluorescence intensity, not switching speed).
- Alternating voltage drives the DNA between lying (close to the quenching gold surface) and standing (extended away) — the switching curve. NSET (1/r⁴) modulates fluorescence in step with the motion.
- Upward switching speed depends on: electrophoretic driving force (E × q_eff) vs. hydrodynamic friction (ξ_rot) at the lever tip
- Rotational drag of the bare rod (Tirado–de la Torre): ξ_rot = πηL³ / (3(ln(L/2r) + δ⊥))
- Additional rotational drag from a bead of Stokes radius R_h at the lever tip (moment arm L): Δξ_rot ≈ 6π η R_h · L²
- Expansion / larger R_h → more friction → slower switching; compaction → faster switching
🔬 Four Measurement Modes
- Static mode — FPS readout (binding kinetics): Static mode = a negative potential holds the DNA stationary, extended away from the surface; FPS is the fluorescence readout used in that mode. The dye on a flexible linker near the target senses environment changes when analyte binds → quenching / anti-quenching → real-time sensorgram → k_on, k_off, K_D. Surface-coverage LOD reaches ~fM in favourable conditions; measurable K_D pM – mM routinely, fM only in tight-binder edge cases where k_off is genuinely ≲10⁻⁵ s⁻¹.
- FRET mode (ternary complex): two dyes on independent strands (donor + acceptor). Analyte binding to a labelled partner alters donor–acceptor distance → FRET efficiency change. Used for cooperativity, ternary complexes (PROTACs, molecular glues), multi-specific analytes.
- Dynamic mode — Dynamic SET (conformation): alternating voltage drives the DNA nanolever to oscillate at high frequencies. Time-resolved fluorescence (via Nanometal Surface Energy Transfer, NSET, to gold) tracks the upward motion; speed ∝ 1 / hydrodynamic friction, so conformational expansion or compaction of the bound target shifts the switching rate.
- Enzyme Activity mode — SET (k_cat, K_M): for nucleic-acid-modifying enzymes (polymerases, reverse transcriptases, nucleases, helicases). Enzymatic elongation / cleavage moves the dye relative to the gold surface → SET fluorescence change → k_obs vs substrate concentration → k_cat, K_M via Michaelis–Menten fit.
📈 FPS Sensorgram → Kinetics
- Analyte flows over chip → binds to target → reporter dye next to target experiences a perturbed local environment → fluorescence intensity changes
- Buffer wash → analyte dissociates → dye environment relaxes → fluorescence returns toward baseline
- Plot F(t) (or ΔF/F₀) vs. time → real-time binding sensorgram
- Fit to 1:1 Langmuir (or more complex models) → k_on, k_off, K_D = k_off / k_on
- For ternary-complex studies, use FRET mode instead: ΔF_donor / F_acceptor reports proximity of two labelled partners
Interactive Simulator
How switchSENSE Works — Practical Guide
🔬 Experimental Setup
- Instrument: heliX+ (Bruker, formerly Dynamic Biosensors). An automated 5-chip carousel feeds chips through one measurement position; each chip carries 1 flow channel with 2 sensor spots (gold microelectrodes, 150 µm diameter, on a glass substrate). Detection uses 4 single-photon counters (E-TCSPC; ps photon-timing precision, ~0.1 µs gating for switching traces) across red (655–685 nm) and green (525–575 nm) channels.
- Chip layout — "molecular lego": three exchangeable DNA building blocks. The anchor strand is fixed on the gold spot via a thiol bond; the adapter strand hybridises to the anchor and carries the fluorescent dye; the ligand strand hybridises to the adapter and carries the immobilised target. Swap the adapter or ligand strand to reconfigure the assay.
- Target conjugation: Amine, thiol, or click chemistries link the target to a ligand strand off-chip; tag-based capture (His, Strep, Biotin, Fc-capture, GFP, GST) is also supported.
- Running buffer: Physiological buffer (PBS, Tris, HEPES) at 50–300 mM ionic strength, always with 0.05% Tween-20. Temperature 15–40°C, flow rate 20–500 µL/min.
- Measurement (static / FPS): A negative potential holds the DNA away from the surface; record dye fluorescence intensity through association and dissociation. AC switching is enabled only for dynamic mode / conformational studies — typically ±0.3 to ±0.5 V (Knezevic JACS 2017 shows 200 mV is already sufficient), well within the gold-thiol SAM electrochemical window. Switching frequencies of kHz–tens of kHz are routine; the dsDNA lever can follow up to ~100 kHz in principle but is rarely driven that hard.
- Fluidics: Cross-over design — sample and buffer flow from two opposite directions across the sensor. Flow switching in ~20 ms, no cross-contamination, in-run sample-line washing, no IFC required.
- Regeneration: high-pH solution (pH 13–14) dehybridises the adapter strand; the anchor stays on the chip and a fresh adapter + ligand pair is loaded. Full cycle ~7 min, no scouting required.
📊 Data Analysis
- FPS sensorgram (default): Plot dye fluorescence intensity (or ΔF/F₀) vs. time during association and dissociation phases → real-time binding sensorgram.
- Kinetic fitting: Fit association/dissociation to 1:1 Langmuir (or more complex models for cooperative / two-step binding) → k_on, k_off, K_D. Global fitting across an analyte concentration series.
- FRET mode (ternary complex): Track donor/acceptor fluorescence ratio → distance proxy as a ternary complex forms. Useful for cooperativity (α) and rapid screening of PROTAC / molecular-glue ternary complexes.
- Dynamic mode (conformational change): Fit each switching trace to a stretched exponential → τ_switch upward and downward components. Asymmetry between them carries information about drag and driving force; Δτ between unbound and bound states reports the conformational change.
- Enzyme Activity (SET): Inject substrate (e.g. dNTPs onto a primer/template duplex) → polymerase elongation moves the dye away from the gold → SET fluorescence increase. Fit mono-exponential at each substrate concentration → k_obs; plot k_obs vs [substrate] → Michaelis–Menten → k_cat, K_M.
- Quality checks: Reference channel subtraction (blank nanolever), concentration-series consistency, dye photobleaching control, baseline recovery after regeneration.
⚡ switchSENSE vs 📡 SPR — Two Philosophies of Surface Biosensing
SPR measures mass. switchSENSE measures dye photophysics in FPS mode, and hydrodynamic friction in dynamic mode. Same kinetics, different physics.
| switchSENSE | SPR (Biacore) | |
|---|---|---|
| What's measured | Dye fluorescence (FPS / FRET) or τ_switch (dynamic) | Resonance angle shift (Δθ, RU) |
| Signal depends on | Dye's local environment (FPS) / donor–acceptor distance (FRET) / hydrodynamic friction (dynamic) | Mass (refractive index change) |
| Ligand attachment | DNA nanolever (16–33 nm spacer) | Direct on surface (dextran, SAM) |
| Small molecule detection | FPS: yes when the dye is perturbed (empirical, no mass-proportional fallback). Dynamic: poor < ~5 kDa | Good (with care, >100 Da) |
| Conformational changes | Direct in dynamic mode (switching reports friction change) | Not direct; RI changes only |
| Multi-modal | FPS + FRET + Dynamic switching | Mass only |
| Regeneration | High-pH denaturation of adapter strand (~7 min cycle) | Glycine/HCl (same surface, may degrade) |
| K_D range | pM – mM routinely (fM only edge cases) (FPS / FRET); pM – µM (dynamic) | pM – mM |
| Best for | Fluorescence-based kinetics on DNA-tethered targets, ternary complexes, conformational change studies | Gold-standard kinetics, small molecules |
🎯 Measurement Mode Selection Guide
Pick by what you want to learn — FPS for routine kinetics, FRET for ternary complexes, dynamic SET for conformational changes, enzyme-activity SET for nucleic-acid-modifying enzymes.
- Static / FPS — binding kinetics (default): Use for routine k_on / k_off / K_D measurements on protein, antibody, nucleic-acid, or small-molecule analytes. Sensitivity depends on how strongly the analyte perturbs the dye's local environment, not on mass — fragments and chemical modifications are accessible. Dye position and linker length matter; expect an empirical optimisation step. Surface-coverage LOD reaches ~fM in favourable conditions; measurable K_D pM – mM routinely (fM only when k_off is genuinely ≲10⁻⁵ s⁻¹).
- FRET — ternary complex studies: Use when you need to report the proximity of two labelled partners (cooperative recruitment in PROTAC / molecular-glue assays, bispecific antibody binding, bi-/multi-specific analytes). Requires donor + acceptor labelling on independent strands.
- Dynamic SET — conformational changes: Use when binding induces an extension, compaction, or domain rearrangement and you want a direct readout of that conformational change. AC voltage drives switching; time-resolved fluorescence (SET-modulated) gives the upward motion speed → reports hydrodynamic friction. Distinctive capability of the platform.
- Enzyme Activity SET — k_cat / K_M: Use for nucleic-acid-modifying enzymes (polymerases, reverse transcriptases, nucleases, helicases). Substrate addition moves the dye relative to the gold electrode → fluorescence change → kinetics of elongation / cleavage.
Key Quantities
| Quantity | Symbol | Typical range | What it tells you |
|---|---|---|---|
| Switching time (bare) | τ₀ | 1–20 µs | Baseline nanolever dynamics |
| Switching time (bound) | τ_bound | 2–200 µs | Drag-loaded dynamics |
| Fractional switching change | Δτ/τ₀ | 5–1000% | Binding signal magnitude |
| Association rate | k_on | 10³–10⁷ M⁻¹s⁻¹ (surface mass-transport ceiling) | Binding on-rate |
| Dissociation rate | k_off | 10⁻⁵ – 20 s⁻¹ (in practice) | Binding off-rate |
| Dissociation constant | K_D | pM – mM routinely (fM in tight-binder edge cases) | Binding affinity |
| Hydrodynamic radius | R_h | 1–20 nm | Size of bound analyte |
| DNA nanolever length | L | 8–33 nm (24–96 bp) | Spacer length, lever arm |
| Effective charge | q_eff | 5–25 e | Electrophoretic driving force |
| Rotational drag | ξ_rot | 10⁻²⁷–10⁻²⁵ N·m·s | Viscous resistance to switching |
Common Pitfalls
Ionic strength too high
Counterion screening reduces q_eff → weak switching. At >300 mM NaCl, dynamics may be too slow or noisy. Reduce to 50–150 mM.
Sub-optimal dye placement (FPS)
FPS signal depends on the dye sensing a perturbed environment when analyte binds. If the dye is too far from the binding site, or shielded, signal is weak. Expect an empirical optimisation of dye position and linker.
Non-specific binding to DNA
Positively charged proteins or broad nucleic-acid binders may bind nonspecifically. Use sequence-matched controls, blocking agents, and reference channels.
Ligand denaturation during conjugation
Amine coupling requires reactive chemistry (NHS esters). Verify ligand functionality after conjugation. Consider biotin-streptavidin as a gentler alternative.
Mass transport limitation
Low flow + high ligand density → analyte depletion near surface → limited k_on. Increase flow rate (≥30 µL/min), reduce nanolever density.
Buffer mismatch
DMSO or high glycerol in analyte changes viscosity → false binding signals. Match buffer composition, use reference subtraction.
Over-interpreting dynamic-mode signals
In dynamic mode, a switching-speed change could be binding, conformational change, or buffer artefact. Always run controls: reference channel, buffer blank, known analytes.
Regeneration incomplete
If high-pH denaturation doesn't fully strip the adapter strand → baseline drift → affinity artefacts. Monitor baseline recovery; extend regeneration if needed.
Strengths & Limitations
Strengths
- • Multi-modal: kinetics (FPS), ternary complex (FRET), and conformational change (dynamic) on the same chip
- • FPS signal is environment-sensitive, not mass-dependent — small molecules, fragments, and conformational rearrangements all detectable
- • Dynamic mode reports hydrodynamic friction — directly sensitive to conformational state, not just mass change. Unique among kinetic biosensors.
- • DNA nanolever provides a well-defined, homogeneous, regenerable surface
- • Target positioned 16–33 nm above the gold electrode — reduces non-specific binding artefacts
- • Fresh surface each regeneration cycle — no cumulative degradation
Limitations
- • FPS sensitivity is dye-position-dependent and not easily predicted ab initio — expect empirical labelling optimisation
- • Dynamic mode insensitive to small molecules (MW < ~5 kDa)
- • Requires DNA conjugation of ligand — extra sample prep vs. SPR
- • Single vendor (Bruker) — smaller installed base than SPR
- • Lower throughput per chip (1 flow channel × 2 sensor spots vs. 8+ channels in high-throughput SPR); 5-chip carousel keeps automated runs continuous
- • Ionic strength constraints (50–300 mM)
- • DNA spacer (16–33 nm) may alter binding if orientation matters
- • Less published literature and regulatory validation than SPR
When NOT to Use switchSENSE
Fragment screening (MW < 500 Da)
FPS may work if the fragment quenches/unquenches the dye, but signal is unpredictable. SPR (Biacore) has better sensitivity and throughput for systematic fragment libraries.
Very high ionic strength
If >500 mM salt is required (e.g., nucleic acid stringency), electrophoretic driving force is too weak. Use SPR or ITC.
Membrane proteins in detergent
Detergent micelles may interact with DNA nanolever or electrode. SPR with L1/HPA chips or nanodiscs is better.
Large routine kinetic panels
Per-chip throughput is 1 flow channel × 2 sensor spots (dual-colour gives up to 4 simultaneous signals). For dense panels, SPRi/BLI throw more channels at once. The 5-chip autoloader buffers long screens but per-cycle parallelism is lower.
Regulatory submissions
SPR (Biacore) is the accepted standard for biosimilar characterization. switchSENSE data may need additional justification.
Broad nonspecific DNA binders
switchSENSE can be strong for defined DNA/RNA binders, but proteins with broad nonspecific DNA affinity need sequence controls and orthogonal validation.
Technique Comparison
| ⚡ switchSENSE | 📡 SPR | 🔬 BLI | 🌡️ MST | |
|---|---|---|---|---|
| Principle | Fluorescence on DNA-tethered targets | Evanescent wave / angle | White-light interferometry | Thermophoresis |
| Signal | Dye environment (FPS), FRET (ternary), τ_switch (dynamic / conformation) | Mass (refractive index) | Mass (optical thickness) | Thermophoretic mobility |
| Channels | 1 channel × 2 spots per chip; 5-chip carousel | 1–8 | 8–96 | 16 capillaries |
| Output | k_on, k_off, K_D + relative size/shape | k_on, k_off, K_D | k_on, k_off, K_D | K_D only |
| Conjugation | DNA conjugation | Direct immobilization | Direct immobilization | Fluorescent label |
| Conformational changes | Yes (dynamic switching mode) | No | No | Indirect |
| Best for | Fluorescence kinetics (FPS), ternary complex (FRET), conformational change (dynamic) | Gold-standard kinetics | Crude samples, speed | K_D screening |
Publication Checklist
🔬 Experimental
- ☐ Instrument stated (heliX+ / heliX or DRX, Bruker)
- ☐ DNA nanolever length and sequence (48 or 96 bp)
- ☐ Ligand conjugation chemistry stated
- ☐ Ligand loading / surface density stated
- ☐ Measurement mode stated (FPS, FRET, or dynamic switching)
- ☐ Running buffer and ionic strength
- ☐ Temperature stated
- ☐ Analyte concentration range and # concentrations
- ☐ Flow rate stated
- ☐ Regeneration conditions and cycle count
- ☐ Reference channel (blank nanolever) described
📊 Analysis
- ☐ Switching-curve fitting method stated (dynamic mode only)
- ☐ Kinetic fitting model stated (1:1 Langmuir, etc.)
- ☐ k_on, k_off, K_D reported ± SD or CI
- ☐ Relative size / R_h reported if sizing was performed
- ☐ Representative sensorgrams shown
- ☐ Residuals or χ² for kinetic fits shown
- ☐ Reference subtraction applied and described
- ☐ Mass transport assessment (flow rate dependence)
- ☐ Control experiments (non-specific binding check)
- ☐ Comparison with orthogonal method if claiming agreement
🔧 Instruments, Chips & Software
Instruments
- heliX+ (Bruker) — current-generation switchSENSE platform. Uses Adapter Chips with 1 flow channel and 2 gold sensor spots per chip, a 5-chip carousel for automated chip exchange, temperature control 15–40°C, cross-over microfluidics with 20 ms flow switching, 4 single-photon counters with E-TCSPC detection across red + green channels, and FPS, FRET, dynamic-SET, and enzyme-activity-SET readouts.
- heliX / DRX (Dynamic Biosensors) — earlier systems still in use in some labs.
Biochips & Software
- Adapter Chip — current standard heliX+ biochip. Modular "molecular lego" surface: anchor strand (fixed, thiol-tethered to gold) + adapter strand (exchangeable, dye-bearing) + ligand strand (exchangeable, target-bearing). Dye choices include red and green options. Reusable via high-pH denaturation (DNA dehybridisation) — a fresh surface every regeneration cycle.
- heliXcyto chip — separate chip line for the single-cell Interaction Cytometry (scIC) platform.
- heliOS software (Bruker) — integrated acquisition and analysis. Switching-trace fitting, kinetic / Michaelis–Menten fits, sensorgram overlay, automated workflow execution.
- Custom analysis — CSV export for Python, R, or MATLAB.
Have SPR or BLI data?
Upload your raw files and get an automated kinetic analysis in minutes. We support Biacore, Octet, and other major formats.
Upload & Analyze