🌡️ Thermal Shift Assay / Differential Scanning Fluorimetry (TSA/DSF)
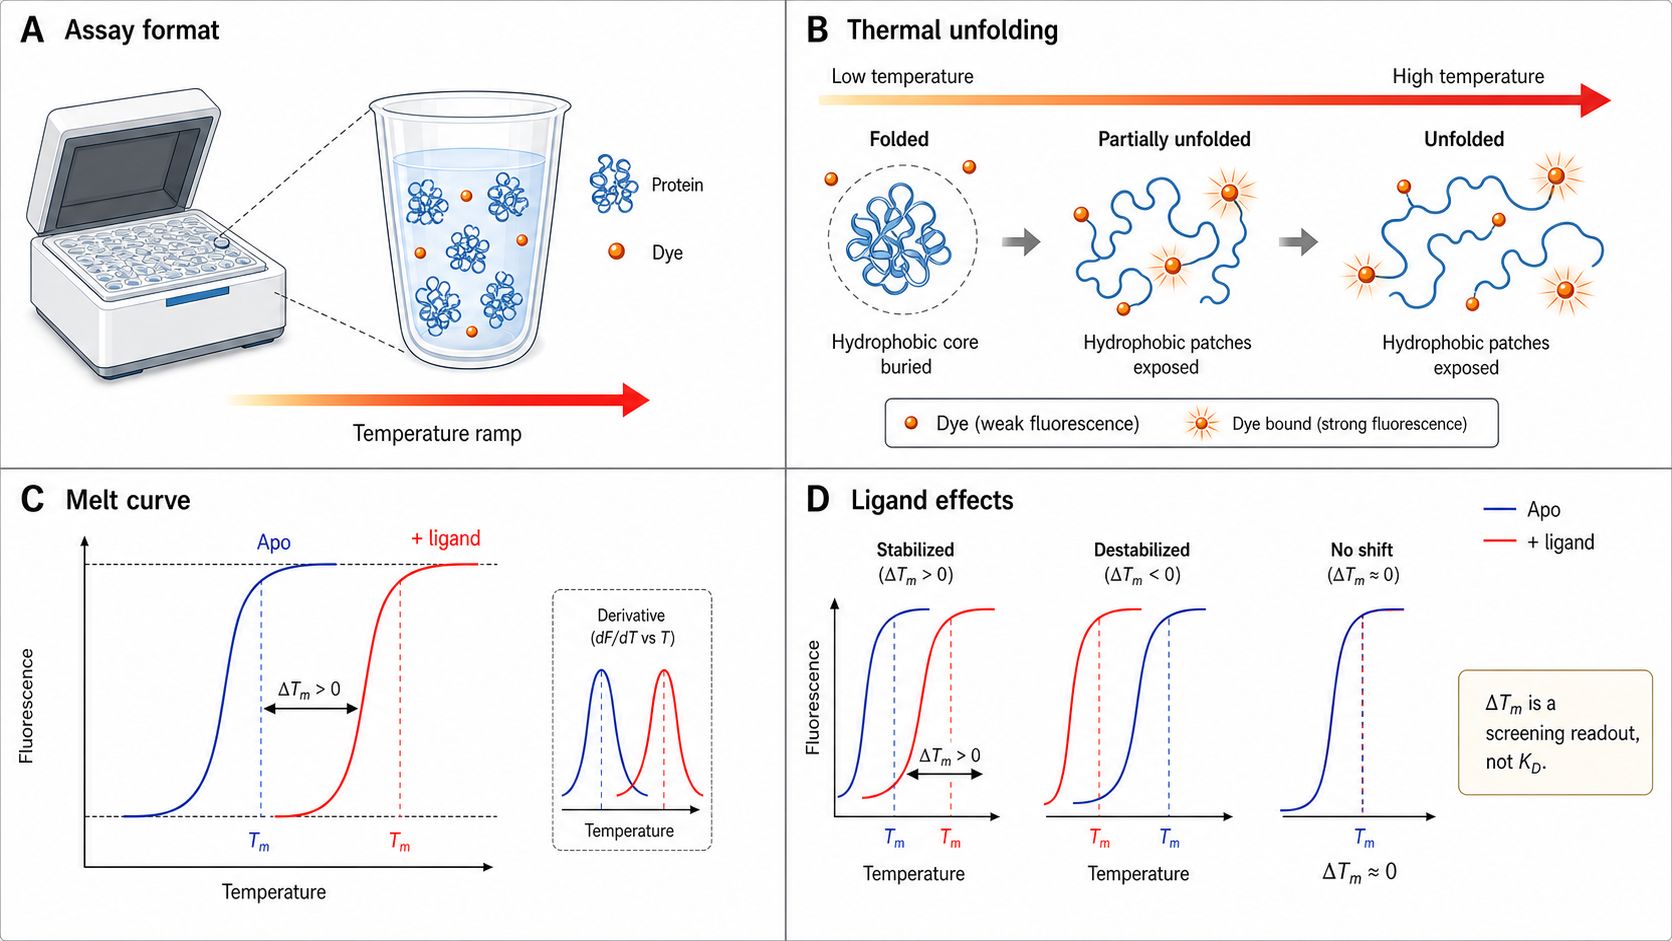
The thermal shift assay is one of the simplest, cheapest, and fastest ways to check if something stabilizes your protein. Mix protein with a hydrophobic fluorescent dye (SYPRO Orange), heat it up, and watch the fluorescence. As the protein unfolds, its hydrophobic core is exposed, the dye binds → fluorescence increases → sigmoidal melt curve → you get Tm. Add a ligand that stabilizes the protein → Tm shifts up → ΔTm is your readout.
Dye-based TSA runs on a compatible real-time qPCR machine with suitable excitation/emission filters. It's widely used for buffer/excipient screening in formulation development, fragment screening in drug discovery, and general "is my protein folded?" QC checks. An entire 96-well plate typically runs in 30–60 minutes with low microgram protein per well.
What a single TSA shift doesn't do: ΔTm is NOT a KD. A +3°C shift from compound A and a +3°C shift from compound B does not mean they have the same affinity — they might bind different sites, have different enthalpic contributions, or stabilize different conformational states. Single-dose TSA is a rank-ordering and triage tool, not a direct quantitative affinity measurement. Dose-response thermal-shift analysis can estimate KD, but only with model assumptions and good controls. For routine KD, use SPR, MST, ITC, or FP.
Key Physics Concepts
Protein Unfolding Thermodynamics
Proteins unfold when thermal energy overcomes stabilizing forces. The two-state model assumes:
N ⇌ UK(T) = exp(−ΔG(T) / RT)
At Tm: K = 1, ΔG = 0, fu = 0.5. Simplified van't Hoff (ΔCp = 0):
K(T) = exp[−(ΔH_u/R)(1/T − 1/T_m)]ΔHu > 0 (unfolding endothermic), so K > 1 above Tm and K < 1 below. Valid within ±15°C of Tm. ΔHu ≈ 100–600 kJ/mol for typical 15–50 kDa globular proteins.
SYPRO Orange — The Reporter Dye
SYPRO Orange is an environmentally sensitive fluorophore:
- In aqueous solution: fluorescence is quenched (low quantum yield)
- In hydrophobic environments: fluorescence is bright (high quantum yield)
- λex ≈ 470 nm · λem ≈ 570 nm (ROX/TAMRA filter)
- 5000× stock in DMSO; use 5–10× final concentration
Folded protein → hydrophobic core buried → low fluorescence. Unfolded protein → core exposed → dye binds → high fluorescence. At higher temperatures, aggregation, precipitation, dye redistribution, and thermal quenching can make the signal plateau or decrease.
Nano-DSF — Label-Free Intrinsic Fluorescence
Nano-DSF eliminates the dye by monitoring intrinsic tryptophan fluorescence:
- Buried Trp (folded): λem ≈ 330 nm (blue-shifted, non-polar)
- Exposed Trp (unfolded): λem ≈ 350 nm (red-shifted, aqueous)
- Ratio R = F350 / F330 often changes upon unfolding — it may increase, decrease, or be less informative than a single wavelength
- Ratiometric readout is less sensitive to concentration and intensity drift than raw fluorescence, but not immune to signal-quality artifacts
Instruments: NanoTemper Prometheus NT.48, Prometheus Panta, Unchained Labs UNit/UNCLE. Requires only 10 µL at 0.1–1 mg/mL.
Interactive TSA/DSF Simulator
Three modes: melt curve physics, ΔTm ligand screening, and nano-DSF (350/330 ratio).
Derivative convention: dF/dT is plotted directly — positive peak at T_m. Some qPCR software plots −dF/dT (designed for DNA melts where fluorescence decreases). For protein DSF, −dF/dT gives a trough at T_m. If you see a trough in your software, invert the sign or read the minimum as T_m.
How DSF Works — The Measurement
🔬 The qPCR Protocol (Dye-Based)
- Prepare plate: 20 µL reactions in 96- or 384-well PCR plate. Common starting point: 1–5 µM protein, 5× SYPRO Orange, buffer of choice, ± ligand/compound.
- Seal plate with optically clear adhesive film.
- Run thermal ramp: 25 → 95°C at 0.5–1°C/min in qPCR machine.
- Read fluorescence every 0.5–1°C (use ROX or TAMRA filter set).
- Analyze: Plot fluorescence vs. T → determine Tm from derivative peak.
Typical runtime: 30–60 min per plate. Requires a real-time qPCR machine with a filter set compatible with SYPRO Orange emission.
🔬 The Prometheus Protocol (Nano-DSF)
- Load capillaries: 10 µL per capillary, up to 48 samples.
- No dye needed — intrinsic Trp/Tyr fluorescence.
- Thermal ramp: 15 → 95°C at 1°C/min (standard).
- Dual-UV detection: F330 and F350 simultaneously.
- Back-reflection: Turbidity / reflected-light loss for aggregation or precipitation onset (Tagg).
- Analyze: Plot 350/330 ratio vs. T → Tm from inflection point.
Assay Design
DSF Assay Design Checklist
- Protein concentration optimization: Run a protein titration (0.5–20 µM) with fixed SYPRO Orange → find the lowest concentration that gives S/N > 3. Too high → inner filter effects; too low → poor signal.
- Dye concentration optimization: Test 2.5×, 5×, 10×, 20× SYPRO Orange → find the concentration that gives good fluorescence without destabilizing the protein (dye binding can lower Tm by 1–3°C at high concentrations).
- Buffer compatibility check: Run buffer-only controls with SYPRO Orange → ensure no dye fluorescence in the absence of protein. Arginine, PEG, and some other excipients interact directly with the dye.
- DMSO tolerance: If screening compounds in DMSO, determine max DMSO concentration that doesn't shift Tm. Many proteins tolerate 1–2% DMSO, but the direction and size of the shift are protein-dependent. Match DMSO across all wells.
- Positive control: Include a known binder with expected ΔTm for plate-to-plate normalization.
- Negative control: Protein + DMSO (no compound) → defines baseline Tm.
- No-protein control: SYPRO Orange + buffer only → confirms no background signal.
- Plate layout: Avoid outer wells (edge effects from thermal gradients). Randomize compound positions.
What Makes a Good TSA Target?
| Protein Feature | Suitability | Why |
|---|---|---|
| Globular, well-folded, single domain | ✅ Ideal | Clean two-state unfolding, sharp transition |
| Multi-domain protein | ⚠️ Multiple transitions | May see 2+ T_m values — each domain unfolds independently |
| Intrinsically disordered | ❌ Poor | Often no cooperative hydrophobic-core exposure → weak, broad, or non-classical signal |
| Membrane protein (in detergent) | ⚠️ Tricky | SYPRO Orange binds detergent micelles → high background. Use nano-DSF or CPM |
| Protein with exposed hydrophobic patches | ⚠️ Caution | High baseline fluorescence even when folded → compressed dynamic range |
| Very thermostable (T_m > 90°C) | ⚠️ Limited | Transition may be beyond instrument range (95–100°C max) |
| Oligomeric protein | ⚠️ Complex | Dissociation + unfolding → multi-step transitions, concentration-dependent T_m |
Interpreting ΔTm
The Schellman equation (quantitative relationship between ΔTm, KD, and [L]):
ΔT_m ≈ (R × T_m² / ΔH_m) × ln(1 + [L] / K_D)T_m in Kelvin · ΔH_m in J/mol (unfolding enthalpy, >0) · K_D at T_m (not at 25°C)
Assumes: binding only to the native state; L_total ≈ L_free (no tight-binding depletion); ΔC_p = 0 (ignoring ΔCp introduces error of several °C for typical ΔCp ~5–10 kJ/mol/K).
Critical caveat: KD at Tm ≠ KD at 25°C. Protein–ligand affinity is temperature-dependent. Extracting KD at 25°C from ΔTm requires assumptions about the temperature dependence of binding — which you usually don't know. This is why ΔTm should not be reported as KD.
Common Assay Formats
Hit Identification
Screen compound library at single concentration (typically 100–500 µM). Hits = compounds with ΔTm > cutoff (typically > 1–2°C above 3σ of DMSO control). Throughput: 96 compounds per plate, 10+ plates per day. False positive rate: ~5–15% (aggregators, fluorescent compounds, DMSO effects). Always validate hits with dose-response and orthogonal methods.
Buffer / Excipient Screening
Optimize protein stability for storage, purification, or formulation. Test pH range (4–9), salt concentrations (0–500 mM), additives (glycerol, sucrose, arginine). Higher Tm often indicates a more thermally stable formulation, but DSF is one part of a broader stability package rather than a stand-alone regulatory requirement.
Fragment Screening
Fragments (MW 150–300 Da) have weak affinity (KD ~ 0.1–10 mM). Need high [fragment] (1–10 mM) to see ΔTm. Typical ΔTm: 0.5–3°C. Advantages: no labeling, no immobilization, very high throughput. Cocktail screening: Pool 5–10 fragments per well → deconvolute hits later. DMSO tolerance critical — keep ≤ 2%.
Protein QC / Batch Comparison
Compare Tm between protein batches → detect stability changes that may come from aggregation, degradation, misfolding, or formulation differences. Tmshould be reproducible within the assay's validated precision. Run alongside SEC-HPLC and orthogonal biophysical assays for comprehensive QC.
Data Analysis
Tm Determination Methods
Method 1: Boltzmann Sigmoid Fit
F(T) = F_min + (F_max − F_min) / (1 + exp((T_m − T) / slope))Four parameters: F_min, F_max, T_m, slope. Simple, works for clean two-state transitions. The slope parameter is empirical — does NOT directly yield ΔH_m. Note: slope = R·T_m²/ΔH_m (the factor-of-4 belongs to the slope of f_u, not to this Boltzmann parameter).
Method 2: First Derivative Peak
Compute dF/dT numerically (Savitzky-Golay smoothing recommended, window 5–11 points). Tm = temperature at the maximum of dF/dT (for protein DSF where F increases). If qPCR software outputs −dF/dT, Tm is the minimum. More robust for noisy data and asymmetric transitions.
Method 3: Van't Hoff Fit
Fit the full two-state model with baseline corrections. Six parameters: F_N, F_U, m_N, m_U, T_m, ΔH_m. Most information-rich but requires clean data and well-defined baselines. ΔH_m from this fit is the van't Hoff enthalpy — compare to calorimetric ΔH from DSC to check two-state assumption.
Common Pitfalls
No visible transition
The protein is already unfolded, Tm is above instrument range, or the protein lacks a hydrophobic core. Run a known stable protein (e.g., lysozyme, Tm ≈ 72°C) as positive control.
High baseline fluorescence
The protein has exposed hydrophobic patches even when folded (common for antibodies, membrane proteins). Reduce SYPRO Orange concentration, or switch to nano-DSF.
Multiple transitions
Multi-domain proteins unfold domain-by-domain. This can be informative if transitions are separated enough to resolve, but overlapping domains can produce misleading apparent Tm values. Fit a sum of transitions only when the data support it.
DMSO artifacts
DMSO can shift Tm in a protein-dependent way. Must keep DMSO constant across all wells and normalize ΔTm to the matched DMSO control — not to the DMSO-free control.
Compound fluorescence
Some compounds fluoresce at the SYPRO Orange emission wavelength → artificial signal increase. Run a "compound + dye, no protein" control. Switch to nano-DSF if compound interference is widespread.
Aggregation-dominated curves
Irreversible aggregation produces broad, asymmetric transitions. Tm from a sigmoidal fit may be inaccurate. Report Tonset (temperature of initial fluorescence increase) instead.
Scan rate dependence
For irreversible unfolding, Tm depends on scan rate (faster scanning → higher apparent Tm). Standard: 0.5–1°C/min. Always report scan rate.
Confusing ΔTm with K_D
The single most common error in the TSA literature. ΔTm is a composite parameter that depends on KD, ΔH_binding, ΔH_unfolding, protein concentration, and ligand concentration. Do not report ΔTm as KD.
Strengths & Limitations
| ✅ Strengths | ❌ Limitations |
|---|---|
| Runs on compatible real-time qPCR instruments | ΔTm ≠ KD (not a direct affinity measurement) |
| Very fast: 30–60 min per 96-well plate | SYPRO Orange binds detergent → unusable for membrane proteins (use nano-DSF) |
| Minimal protein: 1–5 µg per well | Proteins without hydrophobic core give no signal |
| HTS-compatible: 384-well and 1536-well possible | Cannot distinguish binding site or binding mode |
| Excellent for buffer/formulation screening | Irreversible unfolding is scan-rate dependent |
| Fragment screening at very high throughput | Compound fluorescence interference (dye-based) |
| No labeling, no immobilization | Multiple transitions complicate analysis |
| Nano-DSF: label-free and more compatible with detergents | Aggregation obscures thermodynamic parameters |
| Nano-DSF: backreflection/turbidity readout for aggregation onset (Tagg) | Weak binders may give ΔTm below detection limit |
| Extremely low cost per data point | Temperature-dependent KD complicates quantitative analysis |
When NOT to Use TSA
❌ When you need K_D
TSA gives ΔTm, not KD. For affinity, use SPR, MST, ITC, or FP. Even the Schellman/isothermal analysis approach gives only approximate KD with significant assumptions.
❌ For membrane proteins with dye-based DSF
SYPRO Orange often binds detergent micelles → high background or compressed dynamic range. Use nano-DSF, CPM dye, or another detergent-compatible assay.
❌ For intrinsically disordered proteins
No cooperative folded core often means weak, broad, or non-classical thermal-shift signals. Nano-DSF may work if Trp/Tyr environments change during local folding, but interpretation is not a simple global Tm.
❌ When kinetic information is needed
No kon, koff, or residence time. TSA measures equilibrium stability — no kinetic information. Use SPR or BLI for kinetics.
❌ For covalent binders (without modification)
Standard TSA detects reversible stabilization. Covalent modifiers may stabilize or destabilize depending on modification site. Time-dependent incubation experiments can help, but interpretation is complex.
❌ When compound solubility is limiting
Fragment screening requires 1–10 mM compound. Many fragments precipitate at these concentrations → light scattering artifacts. Centrifuge plates before reading, or use nano-DSF with back-reflection.
TSA vs Related Techniques
🌡️ TSA / DSF
- ΔTm (rank-ordering, not KD)
- SYPRO Orange dye or nano-DSF (label-free)
- qPCR machine or Prometheus
- Fastest, cheapest, highest throughput
- 1–5 µg protein per well
- No kinetics, approximate thermodynamics
🔄 CD Thermal Melt
- Tm from secondary structure (optical)
- Monitors backbone conformation (222 or 208 nm)
- No dye → no dye artifacts
- Lower throughput (1 sample at a time, ~1 h per melt)
- More sample: 50–200 µg per experiment
- Better for studying folding intermediates
🔥 DSC (Differential Scanning Calorimetry)
- Direct calorimetric ΔH_cal and Tm
- Gold standard for thermodynamic parameters
- ΔH_cal / ΔH_vH ratio tests two-state assumption
- Highest sample consumption (~0.5–1 mg)
- Slowest (1–3 h per scan)
- Use for detailed characterization of top hits from TSA
🧪 Chemical Denaturation
- ΔG_unfolding at 25°C directly
- Typically reversible (avoids irreversibility artifacts)
- Can distinguish two-state from multi-state unfolding
- Lower throughput: titration series per protein
- Requires good spectroscopic probe
- Use when you need ΔG at physiological temperature
TSA for Drug Discovery
🧩 Fragment Screening
- 384- or 1536-well formats can support very high-throughput fragment screens
- Cocktail screening (5–10 fragments/well) for even higher throughput
- Hit rate: typically 1–5% with ΔTm > 1°C
- Orthogonal validation: SPR (binding kinetics), X-ray crystallography
- Widely used primary or triage screen for FBDD
🎯 Hit-to-Lead Triaging
- Dose-response ΔTm for confirmed hits → rank by apparent potency
- Counter-screen against related proteins for selectivity
- TSA ΔTm trends should correlate with orthogonal affinity measurements
- Flag compounds with dose-dependent fluorescence (interference)
⚗️ Formulation Development
- Screen 96 buffer conditions per plate
- Variables: pH (4–9), NaCl (0–500 mM), additives (sucrose, trehalose, arginine)
- Maximize Tm for long-term storage stability
- Use DSF alongside orthogonal assays in formulation and comparability packages
Publication Checklist
Experimental Design
- ☐Protein concentration and source stated
- ☐SYPRO Orange concentration stated (or nano-DSF noted)
- ☐Buffer composition and pH stated
- ☐DMSO concentration stated and matched across wells
- ☐Scan rate stated (°C/min)
- ☐qPCR instrument and filter set stated
- ☐Number of replicates (≥ 3 technical replicates)
- ☐Positive control (known binder) included
Data Quality
- ☐Tm determination method stated (Boltzmann, derivative, van't Hoff)
- ☐Representative raw melt curves shown (not just ΔTm values)
- ☐ΔTm values with standard deviation / confidence interval
- ☐No-compound (DMSO-only) control Tm reported
- ☐Compound-only (no protein) control for fluorescence interference
- ☐For screening: Z′ factor reported (should be > 0.5). Z′ = 1 − 3(σ_p + σ_n) / |µ_p − µ_n|
Reporting
- ☐ΔTm reported — NOT called KD
- ☐Dose-response shown if available (not just single-dose)
- ☐Hits validated by orthogonal method (SPR, ITC, MST)
- ☐For nano-DSF: 350/330 ratio shown, Tonset and Tagg reported
- ☐Scan rate and heating direction stated
- ☐Irreversibility noted if applicable (no re-cooling data shown)
Instruments for DSF / Thermal Shift
- Compatible real-time qPCR machines — Applied Biosystems QuantStudio, Bio-Rad CFX96/CFX384, Roche LightCycler 480, Eppendorf Mastercycler
- NanoTemper Prometheus NT.48 — nano-DSF, 48 capillaries, intrinsic fluorescence + backreflection aggregation readout
- NanoTemper Prometheus Panta — nano-DSF plus aggregation/particle-size readouts, 48 capillaries, automated loading
- NanoTemper Tycho NT.6 — rapid nano-DSF, 6 capillaries, about 3 min per run, quality control focus
- Unchained Labs UNit / UNCLE — multi-parameter: DSF, DLS, SLS in one instrument
Have SPR or BLI data?
Upload your raw files and get an automated kinetic analysis in minutes. We support Biacore, Octet, and other major formats.
Upload & Analyze