🔬 heliXcyto — Single-Cell Interaction Cytometry
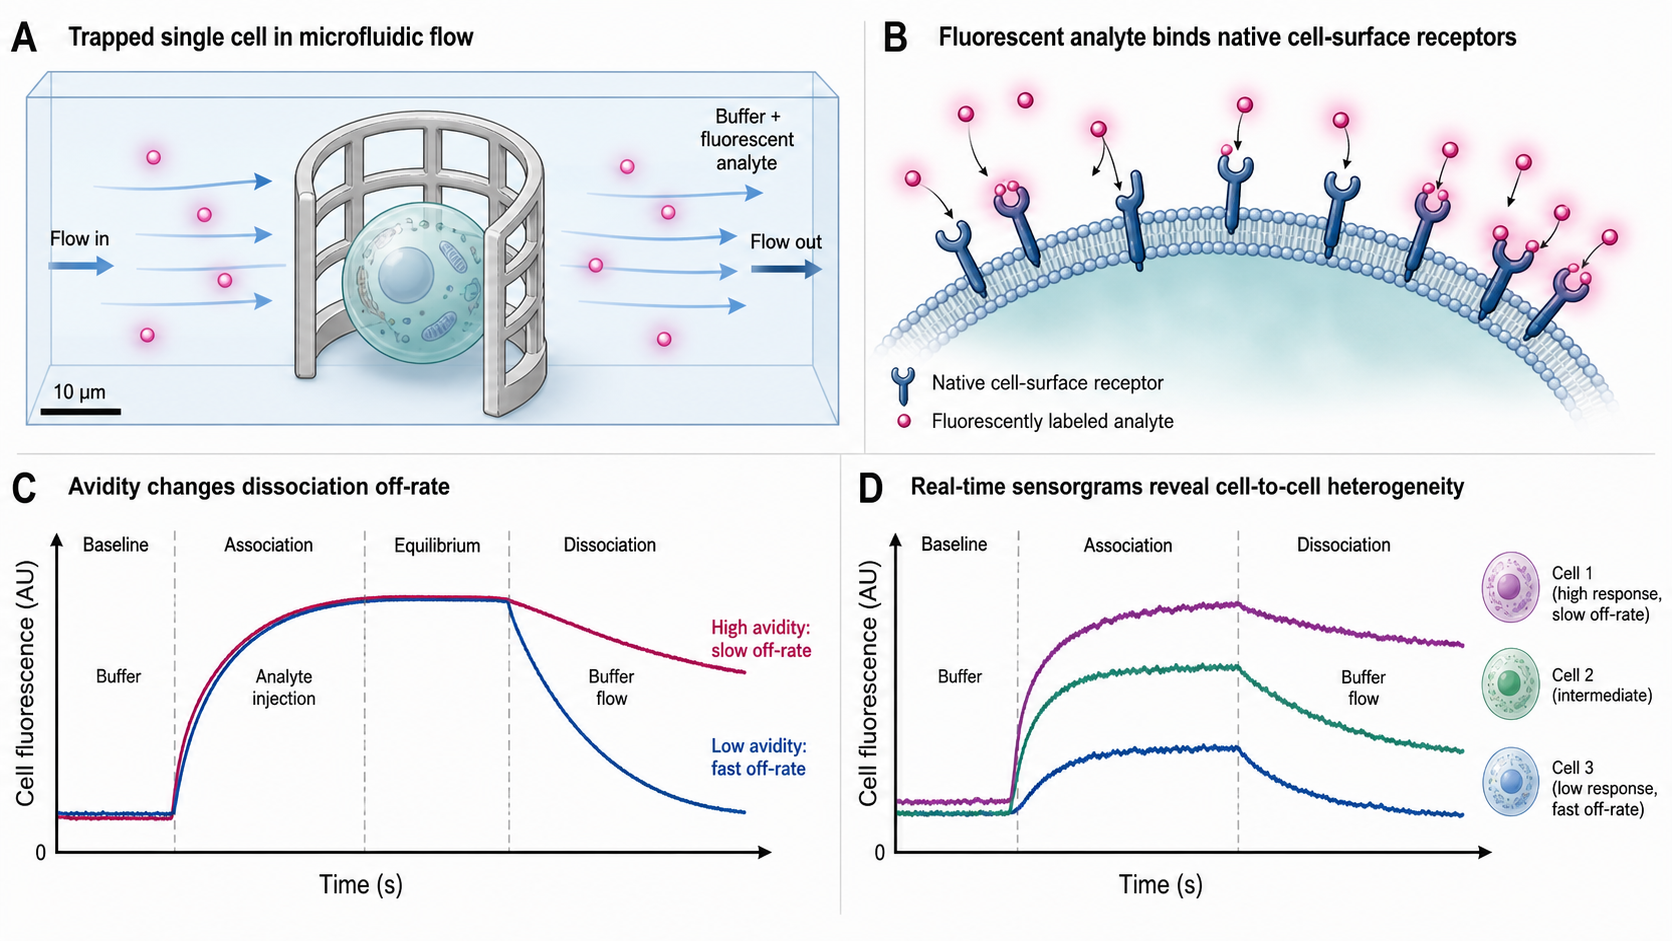
Single-cell Interaction Cytometry (scIC) measures the real-time binding kinetics of fluorescently labeled molecules to targets on the surface of individual living or fixed cells. In the heliX instrument (Bruker, formerly Dynamic Biosensors) operating in cell-cytometry mode (marketed as heliXcyto), cells are physically trapped in flow-permeable polymer cages within a microfluidic channel. A fluorescent analyte (e.g., a labeled antibody) flows over the trapped cells. As the analyte binds to cell-surface receptors, fluorescence accumulates on the cell — monitored in real time by a sensitive fluorescence microscope. During dissociation, buffer flow washes away unbound analyte and fluorescence decays as molecules release. The resulting binding curve — fluorescence intensity vs. time — yields k_on, k_off, and K_D, all measured in the native cell-surface context.
Unlike conventional biosensors (SPR, BLI, switchSENSE) that immobilize purified, recombinant protein fragments on engineered surfaces, scIC preserves the native transmembrane folding, receptor density, lateral mobility, and co-receptor interactions of the target. This makes scIC uniquely suited for measuring avidity — the enhanced apparent affinity that arises when multivalent molecules (e.g., bivalent IgG antibodies) engage multiple receptors simultaneously. scIC also reveals cell-to-cell heterogeneity — not every cell expresses the same number of receptors, and scIC resolves this at the single-cell level.
Native cell surface
Receptors in their physiological membrane environment — correct folding, glycosylation, density, mobility, and co-receptor context.
Real-time kinetics on cells
Full k_on / k_off / K_D measurement, not just endpoint binding (unlike flow cytometry).
Avidity and multivalency
Captures the enhanced binding that bivalent antibodies, bispecific molecules, and multivalent drugs exhibit on cells.
Single-cell resolution
Resolve receptor expression heterogeneity and binding variability across individual cells — not just population averages.
Universal cell trapping
Polymer cages physically trap any eukaryotic cell (adherent or suspension, living or fixed, 6–25 µm) without surface modification.
Automated workflow
96-well plate autosampler, automated cell loading, <1 h from culture to data.
Key Physics Concepts
🔬 Fluorescence Accumulation
- Labeled analyte flows over trapped cells → binds cell-surface receptors → fluorescence accumulates at the cell position
- Signal: F_cell(t) = F_bg + α × N_bound(t)
- Association: Analyte at [A] flows → F(t) increases
- Dissociation: Buffer (no analyte) → F(t) decreases
- Reference spot upstream provides real-time background subtraction: ΔF = F_cell − F_reference
📈 Cell-Surface Kinetics
- Pseudo-first-order mass action, like SPR but with cell-surface receptors as "ligand"
- k_obs = k_on×[A] + k_off — applies to the rising association phase under pseudo-first-order conditions; for biphasic systems this is an early-time approximation, and k_off here refers to the fast/monovalent rate (k_off,1).
- Real cell-surface binding is often biphasic: fast (monovalent) + slow (bivalent) dissociation
- k_off,1 (fast) matches intrinsic SPR k_off; k_off,2 (slow) is avidity-enhanced — often 10–100× slower
🧬 Single-Cell Resolution
- Standard assays (ELISA, flow cytometry MFI) report the average across thousands of cells — hiding biologically important variation
- "50% positive" could be 50% high-expressors + 50% negative, or 100% cells at moderate expression — same average, completely different biology
- scIC: each cell yields its own binding curve → individual k_off, receptor density, and curve shape → distributions, not single numbers
See How It Works
A cell is trapped in a flow-permeable polymer cage inside a microfluidic channel. Fluorescently labeled analyte flows in from the left, binds to surface receptors, and makes the cell glow. The live sensorgram on the right tracks the binding curve in real time — buffer wash reveals how tightly molecules are held.
Drag to orbit · scroll to zoom · the cell is captured by flow into the open polymer cage, analyte flows over it and binds, then buffer wash releases it.
Interactive Simulator
How scIC Works — Practical Guide
🔬 Experimental Setup
- Instrument: heliXcyto (Bruker). Reflected-light microscope with two-color fluorescence detection, integrated microfluidics, 96-well autosampler
- Chip: Polymer cage cell traps (RFID-tagged). Single-cell and 5-cell configurations, trap sizes for 6–25 µm cells
- Cell prep: ~2×10⁶ cells/mL. Optional 2% PFA fixation. Strain through 30 µm filter to remove clumps
- Labeling: Analyte conjugated to fluorescent dye (heliXcyto kit). Target DOL: 2–4
- Cell loading: Automated aspiration, trapping in polymer cages. Verify by microscopy
- Measurement: 300 s association, 600–1800 s dissociation. Flow up to 500 µL/min. Temperature: 15–40°C
- Regeneration: Reverse flow washes cells out. Chips are reusable
📊 Data Analysis
- Normalization: heliOS software normalizes using a known fluorophore standard to correct for optical path and LED intensity variations
- Background subtraction: Reference spot (upstream, no cell) subtracted in real time → removes bulk solution fluorescence
- Curve fitting: Association → monophasic exponential → k_obs. Dissociation → monophasic or biphasic exponential → k_off,1 (± k_off,2)
- Kinetic extraction: k_on = (k_obs − k_off,1)/[A] using the fast/monovalent off-rate; for biphasic systems, association is typically fit globally rather than via a single k_obs. K_D = k_off/k_on. Report both intrinsic and apparent (avidity-enhanced)
- Half-life: t½ = ln(2)/k_off. For biphasic, Newton-Raphson on the bi-exponential
- Population analysis: Distributions of kinetic parameters and fluorescence amplitudes across cells
🔬 scIC vs 📡 SPR — Native Cells vs Purified Proteins
SPR measures what a protein does in isolation. scIC measures what it does on a cell. Both are "correct" — they answer different questions.
| scIC (heliXcyto) | SPR (Biacore) | |
|---|---|---|
| Surface | Actual cell membrane | Engineered sensor chip (CM5, SAM) |
| Target | Full-length transmembrane protein, native | Soluble ECD, recombinant |
| Avidity | Yes — bivalent engagement on dense receptors | Minimal — low density, no lateral mobility |
| K_D reflects | Biological potency (avidity-inclusive) | Intrinsic molecular affinity |
| Dissociation | Often biphasic (mono- + bi-valent) | Typically monophasic |
| Heterogeneity | Resolved (single-cell) | N/A |
| Analyte | Must be fluorescently labeled | Label-free |
| Throughput | 1–5 cells/chip, multiple chips/run | 1–8 channels, high cycle count |
| K_D range | pM – µM (avidity shifts apparent K_D tighter) | pM – ~100 µM (mM range accessible only via steady-state at very high [A]) |
| Best for | On-cell potency, avidity, heterogeneity | Intrinsic affinity, mechanism, SAR |
🎯 When to Use scIC vs Other Methods
scIC does not replace SPR. It answers questions SPR cannot.
- Use scIC when: You need to know how your molecule behaves on actual cells — avidity, receptor density dependence, cell-type comparison, heterogeneity, or targets that lose function when solubilized (e.g., GPCRs)
- Use SPR when: You need intrinsic k_on, k_off, K_D for SAR, fragment screening, or regulatory submissions
- Use flow cytometry when: You need population-level binding (EC₅₀) across millions of cells, multi-parameter phenotyping, or sorting
- Use BLI when: You need fast kinetic screening in crude matrices without purification
Key Quantities
| Quantity | Symbol | Typical range | What it tells you |
|---|---|---|---|
| Association rate | k_on | 10³–10⁷ M⁻¹s⁻¹ | Binding on-rate (same meaning as SPR) |
| Dissociation rate (intrinsic) | k_off,1 | 10⁻⁴–10⁻¹ s⁻¹ | Monovalent off-rate (comparable to SPR) |
| Dissociation rate (avidity) | k_off,2 | 10⁻⁶–10⁻² s⁻¹ | Bivalent/avidity-enhanced off-rate |
| K_D (intrinsic) | K_D,1 | pM – µM | Molecular affinity |
| K_D (apparent) | K_D,app | pM – µM | Effective on-cell affinity (avidity-inclusive) |
| Receptor density | N_receptors | 10³–10⁶/cell | Expression level of target |
| Receptor spacing | d_receptor | 10–1000 nm | Determines avidity probability |
| Half-life | t½ | min – hours | Residence time of drug on cell |
| Degree of labeling | DOL | 1–5 | Fluorophores per analyte molecule |
Common Pitfalls
Labeling artifacts
Over-labeling (DOL > 6) can reduce binding affinity. Under-labeling (DOL < 1) makes some molecules invisible. Always verify binding activity post-labeling.
Cell viability
Living cells may internalize bound antibody (t½ ~15–60 min), confounding dissociation. Use fixed cells (PFA) for long dissociation measurements. For live-cell measurements, verify cell health before loading: dye exclusion (e.g., DAPI or PI) and normal morphology by microscopy are minimum checks.
Mass transport limitation
Mass transport limitation is a major concern in surface sensors such as SPR, where signal comes from the near-wall region and local flow velocity approaches zero. In scIC, fluorescence is collected across the channel volume, including faster-flowing regions away from the wall, so this artifact is less likely. Still check flow-rate and concentration dependence for very fast binders, high receptor density, or unusually low flow.
Non-specific binding
Fluorescent analyte sticking to polymer cage or membrane inflates signal. Use target-negative control cells and reference subtraction.
Photobleaching
Extended measurements (>1800 s) at high LED power can mimic dissociation. Use minimal LED power (0.1–0.15%).
Comparing scIC K_D to SPR K_D
They measure different things. scIC includes avidity; SPR does not. A 10× difference is expected, not an error.
Cell clumping
Multiple cells in one trap corrupt single-cell data. Strain cells (30 µm), verify occupancy by microscopy.
Receptor saturation
If [A] >> K_D, association is instantaneous and k_on is unresolvable. Use 0.1–10× K_D concentrations.
Fc-receptor (FcγR) binding
IgG analytes can bind Fcγ receptors on FcγR-positive cell lines (e.g., certain CHO-K1 clones, monocyte/macrophage lines), producing a second binding population unrelated to the target. Use Fab or F(ab′)₂ fragments as controls, or block FcγRs before measurement.
Receptor turnover and shedding
Living cells continuously synthesize and shed surface receptors. Over long dissociation phases (>600 s), targets with rapid turnover (e.g., EGFR shedding) can cause apparent signal loss independent of analyte dissociation. Use fixed cells or verify stability with a no-analyte control.
When NOT to Use scIC
Fragment screening
Fragments (< 1 kDa) bind too weakly and transiently. Labeling is impractical. Use SPR or TSA/DSF.
High-throughput SAR
With 1–5 cells/chip, scIC cannot screen >100 compounds. Use SPR (Biacore 8K) or SPRi.
Regulatory submissions
Regulatory bodies expect intrinsic SPR K_D. scIC K_D includes avidity and is cell-dependent.
Soluble protein–protein
If neither partner is membrane-associated, there is no cell to trap. Use SPR, BLI, ITC, or FIDA.
Bacterial targets
Polymer cages are designed for eukaryotic cells (6–25 µm). Bacteria (~1 µm) are too small.
Concentration measurement
scIC fluorescence reports bound molecules, not absolute analyte concentration. Use SPR or ELISA.
Strengths & Limitations
Strengths
- Kinetics in native cell-surface context — captures avidity, density, membrane effects
- Single-cell resolution reveals population heterogeneity
- Works with any eukaryotic cell (adherent, suspension, living, fixed)
- Real-time k_on, k_off, K_D, and t½ — not just endpoint binding
- Two-color fluorescence enables dual-analyte or competition experiments
- Automated: 96-well plate, auto-cell loading, multi-chip exchange
- Directly relevant for biologics where on-cell potency is the goal
- Temperature range 15–40°C for physiologically relevant conditions
Limitations
- Requires fluorescent labeling — not label-free
- Low cell throughput (1–5 cells/chip) vs. flow cytometry (10⁴–10⁶)
- Labeling may alter analyte binding — requires DOL optimization
- k_off > ~0.1 s⁻¹ pushes the limit of the time resolution — very fast kinetics are difficult to resolve
- Receptor internalization confounds long dissociation on living cells
- Single vendor (Bruker) — limited installed base
- Avidity-enhanced K_D is cell-line dependent — not a universal constant
- No sizing or conformational info — unlike switchSENSE, the sister technology from the same vendor
scIC vs Related Techniques
| scIC (heliXcyto) | SPR (Biacore) | BLI (Octet) | Flow cytometry |
|---|---|---|---|
| Fluorescence on trapped cells | Evanescent wave on sensor chip | White-light interferometry on fibers | Fluorescence on cells in flow |
| 1–5 cells/chip | 1–8 channels | 8–96 sensors | 10⁴–10⁶ cells/run |
| Real-time kinetics | Real-time kinetics | Real-time kinetics | Endpoint (or time-course aliquots) |
| Fluorescent label required | Label-free | Label-free | Fluorescent label required |
| Native cell surface | Purified protein on chip | Purified protein on fiber | Native cell surface |
| Single-cell resolution | N/A | N/A | Single-cell (but endpoint) |
| Avidity captured | Avidity absent | Avidity absent | Avidity captured (no kinetics) |
Publication Checklist
🔬 Experimental
- Instrument (heliXcyto, Bruker) and chip type stated
- Cell line, passage number, preparation (living/fixed)
- Analyte labeling: dye identity, DOL, method
- Analyte concentrations and association/dissociation times
- Flow rate and temperature stated
- LED power and detection channel stated
- Negative control cells included
- Running buffer composition stated
📊 Analysis
- Software (heliOS version) stated
- Normalization and reference subtraction described
- Kinetic model stated (monophasic/biphasic)
- k_on, k_off (both phases if biphasic) reported ± SD
- K_D clearly labeled intrinsic vs. apparent
- t½ with calculation method stated
- Number of cells and per-cell distributions shown
- Binding curves shown with residuals
Instruments & Consumables
heliX / heliXcyto (Bruker, formerly Dynamic Biosensors)
First commercial single-cell-resolved interaction cytometry platform (prior art for on-cell kinetics includes LigandTracer from Ridgeview Instruments, which measures whole-dish averaged kinetics without single-cell resolution). Built-in reflected-light microscope, two-color fluorescence (red + green), 96-well autosampler (4–40°C), temperature-controlled measurement (15–40°C), flow rates up to 500 µL/min, RFID-chipped auto-exchange (5 chips), heliOS network for multi-instrument control.
Chips
Single-cell chips: One polymer cage per spot — best for heterogeneity studies. Multi-cell chips (M5): Five cages per spot — better statistics, averages across 5 cells. Multiple trap sizes for 6–25 µm cells.
Software
heliOS: Integrated acquisition, real-time visualization, curve normalization, kinetic fitting (mono/biphasic), half-life calculation (Newton-Raphson), multi-instrument control.
Have SPR or BLI data?
Upload your raw files and get an automated kinetic analysis in minutes. We support Biacore, Octet, and other major formats.
Upload & Analyze