✨ Surface Plasmon Resonance (SPR)
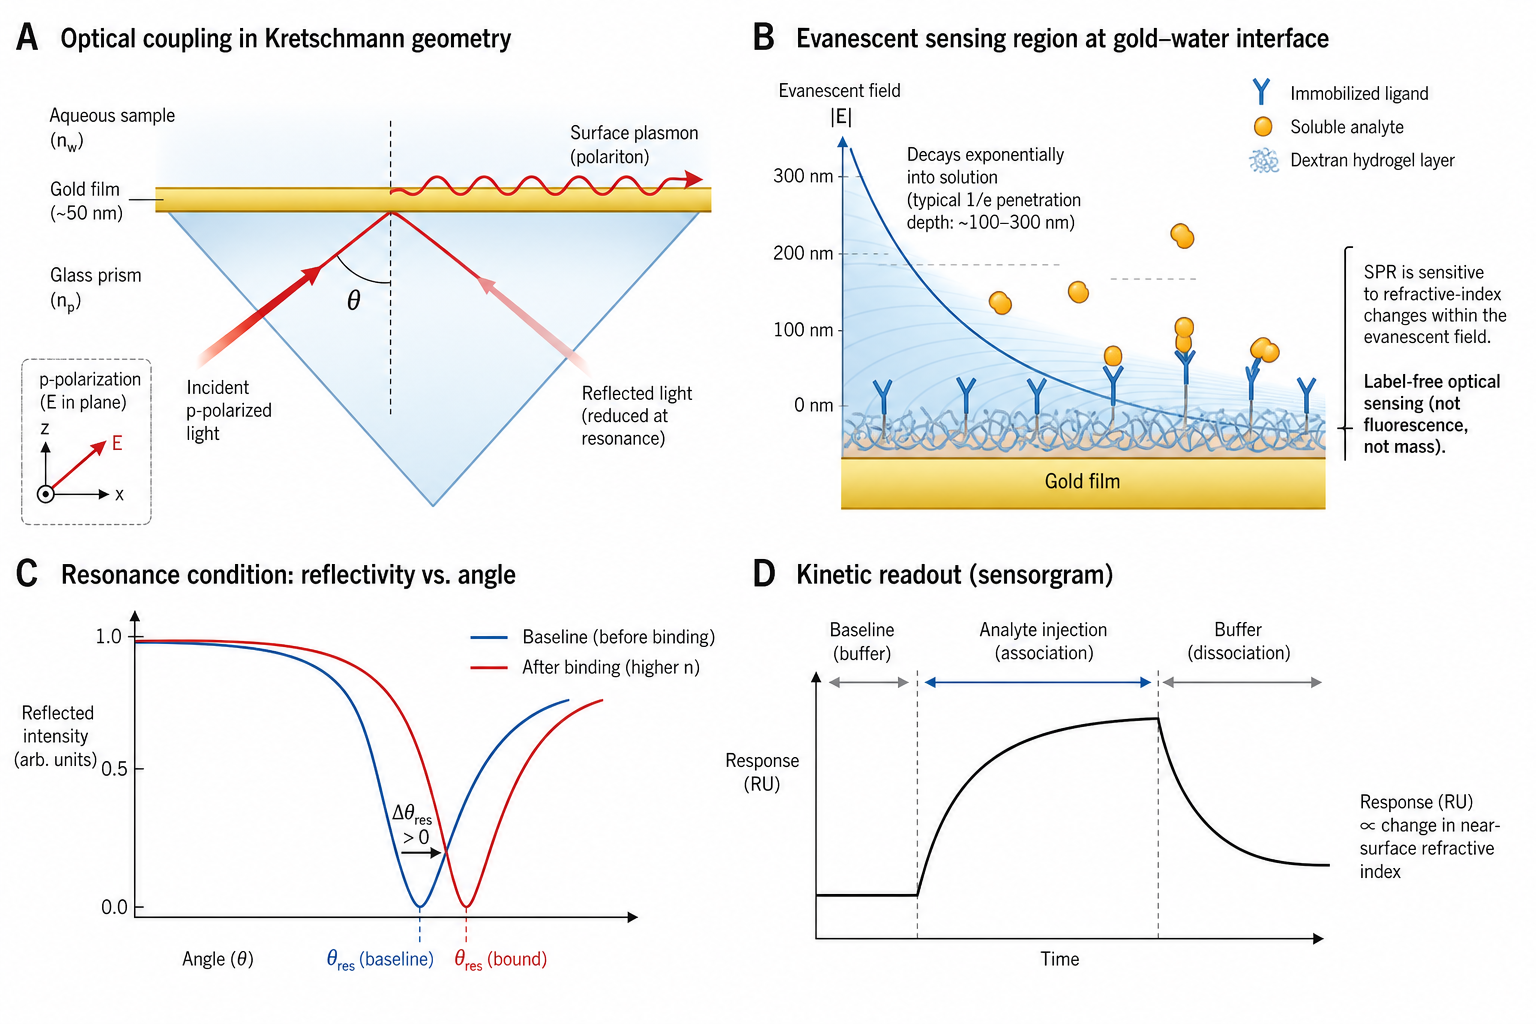
Surface Plasmon Resonance (SPR) exploits surface plasmons — collective oscillations of free electrons at a metal-dielectric interface, described by Maxwell's equations. When p-polarized (TM) light hits a thin gold film at a specific angle (the resonance angle), energy couples into these plasmons, creating an evanescent wave whose field amplitude decays into the solution with a 1/e depth dp ≈ 200 nm at 633 nm (the field is non-negligible out to ~3·dp). Only p-polarized light can excite surface plasmons — s-polarized light does not couple to the surface charge oscillation.
Changes in refractive index near the gold surface — caused by molecular binding events — shift the resonance condition, producing a measurable signal in real time. This makes SPR the gold standard for label-free interaction analysis, delivering both kinetic rate constants (ka, kd) and equilibrium affinity (KD) from a single experiment.
Evanescent field sensing
The field decays exponentially from the surface (1/e field-amplitude depth d_p ≈ 200 nm at 633 nm; intensity ∝ |E|² decays twice as fast). Only molecules near the surface contribute to the signal — intrinsic surface selectivity.
Real-time kinetics
Monitor association and dissociation in real time. Extract ka, kd, and KD from a single multi-cycle or single-cycle kinetics experiment.
Label-free detection
No fluorescent tags, radioactive labels, or enzymatic reporters needed. Measure native molecules in near-physiological conditions.
Mass sensitivity
1 RU ≈ 1 pg/mm² assumes protein dn/dc ≈ 0.18 (Stenberg/Biacore calibration on CM-dextran); the conversion differs for nucleic acids, lipids, glycoproteins, and PEG (dn/dc ≈ 0.13). SPR-specific unit; do not convert directly to BLI nm shifts (different physics).
Versatile surface chemistry
CM5 (carboxymethyl dextran), NTA (His-tag capture), SA (streptavidin), lipid capture — extensive toolkit for immobilization strategies.
Key Physics Concepts
🔺 Kretschmann Configuration
The dominant optical coupling scheme for SPR biosensors. Light passes through a high-index glass prism (BK7, n ≈ 1.515) and undergoes total internal reflection (TIR) at the prism-gold interface. The evanescent field from TIR penetrates the thin gold film (~47–50 nm) and excites surface plasmons on the opposite (solution) side.
Alternative configurations: Otto (prism separated from metal by an air gap — rarely used for biosensing) and grating coupling (no prism needed; used in some miniaturized and imaging SPR formats).
📐 Resonance Condition
Surface plasmons are excited when the in-plane component of the photon wavevector matches the surface plasmon wavevector. This momentum-matching condition can only be satisfied via prism or grating coupling — free-space light cannot directly excite surface plasmons because its wavevector is always too small.
Changes in the dielectric environment (molecular binding) alter kSP, shifting the resonance angle or wavelength. This shift is the SPR signal.
🌊 Evanescent Field
The surface plasmon generates an electromagnetic field that decays exponentially from the gold surface into the solution. The penetration depth dp (where the field amplitude drops to 1/e, per the Homola convention) is ≈ 200 nm at 633 nm on Au/water; intensity (∝ |E|²) decays twice as fast, so the 1/e intensity depth is ~100 nm. The field is non-negligible out to ~3·dp.
This shallow penetration depth is a feature, not a limitation: it makes SPR inherently surface-selective. Bulk refractive index changes (e.g., buffer mismatch) affect the signal uniformly but can be subtracted using a reference channel.
Interrogation Modes
SPR instruments measure shifts in the resonance condition using one of three interrogation strategies. Each has distinct advantages — and the interactive simulator below lets you explore all three.
Angular Interrogation
Fix the wavelength (typically 633 nm or 760 nm), sweep the angle, and track the reflectivity minimum. The shift in resonance angle Δθ is proportional to the refractive index change. Used in most Biacore instruments.
Wavelength Interrogation
Fix the angle, illuminate with broadband (white) light, and track the wavelength of the reflectivity minimum. Enables simultaneous multi-spot measurements via imaging. BioNavis MP-SPR Navi is the canonical multi-wavelength platform; some imaging SPR systems also use this scheme.
Intensity Interrogation
Fix both angle and wavelength at the steepest part of the resonance curve and monitor reflectivity changes. Fastest time resolution but narrowest dynamic range. Used in some imaging SPR and high-speed kinetics setups.
Fresnel Model & Gold Optical Constants
The SPR reflectivity curve is calculated using the 3-layer Fresnel equations (Airy formula) for a prism/gold/sample stack. The gold film is described by its complex dielectric function ε(ω) = ε' + iε'', where the real part is large and negative (metallic behavior) and the imaginary part represents optical loss.
Layer 1: BK7 prism — n ≈ 1.515 (non-dispersive in visible range)
Layer 2: Gold film — ε from Johnson & Christy (1972); thickness 40–55 nm
Layer 3: Sample — n ≈ 1.333 (buffer) + Δn from molecular binding
Signal — Δθ or Δλ of the reflectivity minimum tracks binding in real time
Interactive: Advanced SPR Physics Simulation
Fixed λ = 633nm. Sweeps angle to find reflectivity minimum. Most common in Biacore.
- • Gold thickness: Optimal ~47-50 nm for 633 nm light. Thinner = broader dip (over-coupling), thicker = shallower dip (under-coupling). Optimal ~47-50 nm balances coupling efficiency and ohmic loss.
- • Binding: Changes local refractive index by ~10-6 RIU per 1 RU (~1 pg/mm²).
- • Evanescent field: Decays exponentially, ~300nm penetration. Only mass near surface is detected.
- • Prism geometry: Shown as triangle for clarity. Real SPR uses hemispheres or right-angle prisms. This is the Kretschmann configuration — the standard geometry used in most commercial SPR instruments.
- • Uses Fresnel equations with Johnson & Christy gold optical constants.
Common Applications
💊 Drug Discovery
Hit validation, lead optimization, and fragment screening. SPR is the industry standard for characterizing drug-target interactions — measuring ka, kd, and KD in a single experiment. Fragment-based drug discovery (FBDD) relies heavily on SPR to detect weak binding of low-molecular-weight compounds.
🧬 Antibody Characterization
Epitope binning, affinity ranking, and detailed kinetics of therapeutic antibodies. SPR is required by regulatory agencies (FDA, EMA) for biosimilar comparability studies. Multi-cycle kinetics (MCK) and single-cycle kinetics (SCK) enable high-throughput antibody screening campaigns.
🔬 Biomolecular Interactions
Protein-protein, protein-nucleic acid, protein-lipid, and protein-small molecule interactions. Concentration analysis (calibration-free concentration analysis, CFCA). Enzyme kinetics on immobilized substrates. Membrane protein interactions using liposome capture or lipid nanodisc approaches.
Technology Comparison: SPR vs BLI vs GCI vs QCM-D
| Feature | SPR | BLI | GCI | QCM-D |
|---|---|---|---|---|
| Sensing Principle | Surface plasmon resonance (RI) | White light interferometry (optical thickness) | Waveguide interferometry (RI) | Acoustic shear wave (mass + viscoelasticity) |
| Signal Unit | RU (1 pg/mm²) | nm shift | pm shift | Hz (Δf) + D (dissipation) |
| Detection Limit | ~0.1 pg/mm² | ~10 pg/mm² | ~0.1 pg/mm² | ~0.5 ng/cm² |
| Throughput | Low–Medium (1–8 channels) | High (96/384-well) | Medium (up to 8 channels) | Low (1–8 channels) |
| Microfluidics | Yes (precise flow control) | No (dip-and-read) | Yes | Yes (flow cell) |
| Mass Transport Control | Excellent (controlled flow rate) | Limited (dip format) | Good | Moderate |
| Wet vs Dry Mass | Dry (optical RI) | Dry (optical) | Dry (optical RI) | Wet (incl. coupled solvent) |
Practical Considerations
Immobilization Strategy
The most common approach is amine coupling (EDC/NHS) to a carboxymethyl dextran surface (CM5). Alternatives include His-tag capture (NTA chip), biotin-streptavidin (SA chip), and direct thiol coupling. The choice affects orientation, activity, and regeneration conditions. Rule of thumb: immobilize the smaller partner when possible to maximize the signal-to-noise ratio.
Mass Transport Limitation
If the analyte binds faster than it can diffuse to the surface, the observed ka is underestimated. SPR's microfluidic flow cells provide controlled mass transport, but high-density surfaces and fast binders still require careful experimental design: use low immobilization levels and high flow rates (≥30 μL/min).
Bulk Refractive Index Effects
Buffer mismatches between running buffer and sample buffer cause instant jumps in the sensorgram that mask true binding signals. Always match buffers carefully and use a reference channel (blank surface or irrelevant protein) for double referencing. DMSO solvent correction is essential for fragment screening.
Regeneration
After each binding cycle, the surface must be regenerated (analyte removed) without damaging the immobilized ligand. Common conditions: low pH (glycine-HCl pH 1.5–3.0), high salt (NaCl), mild detergent, or combination pulses. Incomplete regeneration or surface damage limits the number of usable cycles.
Non-Specific Binding (NSB)
Basic analytes (high pI) can stick to negatively charged CM5 dextran. Mitigations: switch to lower-charge surfaces (CM4, C1), add carrier protein (BSA) or detergent (Tween-20) to running buffer, or use reference subtraction. Always check binding to a blank/reference flow cell to distinguish specific from non-specific signal.
Avidity with Bivalent Analytes
IgGs flowed over immobilized antigen can engage two surface-bound antigens simultaneously, producing apparent kd values that are orders of magnitude slower than the intrinsic monovalent off-rate. To measure intrinsic kinetics, invert the assay (capture the IgG, flow monomeric antigen) or use Fab fragments. Surface heterogeneity can also masquerade as biphasic (two-state) kinetics — consider ligand-density titrations before fitting complex models.
Temperature Control
kd is strongly temperature-dependent (van't Hoff): a 10 °C change can shift KD by an order of magnitude. Always state the analysis temperature — the convention is 25 °C unless otherwise specified. Temperature scans (van't Hoff or Eyring analysis) decompose ΔG into ΔH and ΔS contributions.
Instruments using SPR
Cytiva Biacore — 8K+, T200, S200, X100; angular interrogation with microfluidics. The dominant SPR platform in pharma, used in FDA/EMA regulatory submissions.
Carterra LSA — High-throughput SPR with 384-channel imaging array. Designed for antibody screening campaigns — epitope binning and affinity ranking at scale.
Bruker Sierra SPR-32 Pro / SPR-24 Pro — High-throughput SPR with integrated microfluidics (formerly Sierra Sensors / Pioneer; rebranded after Bruker acquisition). Competitive alternative to Biacore for kinetics and affinity measurements; Bruker also markets the Creoptix WAVE GCI platform.
Reichert 2SPR / 4SPR — Angle-scanning SPR at a fixed wavelength (780 nm). Open architecture with flexible sample handling options.
Others — BioNavis MP-SPR Navi (multi-wavelength / multi-parametric SPR), Biosensing Instrument (BI), IBIS Technologies (imaging SPR), Horiba (SPR + electrochemistry).
Related: Localized SPR (LSPR) — distinct mechanism
Nicoya OpenSPR — Benchtop localized SPR using gold nanoparticles (dipolar plasmon resonance) rather than a continuous gold film. LSPR does not require Kretschmann momentum-matching: free-space light directly excites nanoparticle plasmons, and binding is detected as a wavelength shift in the extinction spectrum. Different physics, shorter sensing depth (~tens of nm), and lower bulk RI sensitivity than propagating SPR — but simpler optics and a smaller footprint.
Related Topics
Have SPR or BLI data?
Upload your raw files and get an automated kinetic analysis in minutes. We support Biacore, Octet, and other major formats.
Upload & Analyze