🌡️ Isothermal Titration Calorimetry (ITC)
ITC is the only routine biophysical technique that directly measures binding enthalpy (ΔH) — the heat released or absorbed during a molecular interaction — in a single titration at constant temperature. No labeling. No immobilization. No surface artifacts. Just two molecules in solution and the fundamental thermodynamics of their binding. From a single titration, ITC yields the dissociation constant (KD), stoichiometry (n), enthalpy (ΔH), and entropy (−TΔS) — the complete thermodynamic signature. This makes ITC uniquely powerful for understanding why molecules bind, not just how tightly. (Note: DSC also measures heat directly, but for thermal transitions such as protein unfolding — not binding events at constant temperature.)
Key Thermodynamic Concepts
Enthalpy (ΔH)
The heat of binding — directly measured by the calorimeter. Driven by hydrogen bonds, van der Waals contacts, and electrostatic interactions at the binding interface. Exothermic reactions (ΔH < 0) release heat; endothermic reactions (ΔH > 0) absorb it. ΔH is the only thermodynamic parameter ITC measures directly — everything else is derived.
Entropy (−TΔS)
The entropic contribution to binding, derived from ΔG and ΔH. Note: −TΔS is the entropic contribution to ΔG, so a negative −TΔS (i.e. positive ΔS) is favorable for binding. Favorable entropy (−TΔS < 0) arises from the hydrophobic effect — release of ordered water molecules from nonpolar surfaces upon binding. Unfavorable entropy (−TΔS > 0) reflects loss of conformational freedom.
Gibbs Free Energy (ΔG)
The master equation: ΔG = ΔH − TΔS = −RT ln Ka. ΔG determines binding affinity — it must be negative for spontaneous binding. Crucially, two compounds with identical KD can have completely different ΔH/ΔS profiles (enthalpy–entropy compensation). ITC reveals this hidden thermodynamic landscape that affinity measurements alone cannot.
Interactive ITC Simulator
Explore isothermal titration calorimetry: thermograms, c-values, and thermodynamic signatures
ITC Thermogram Simulator
Simulate a realistic ITC experiment. Adjust binding parameters and observe how the raw thermogram and integrated isotherm change.
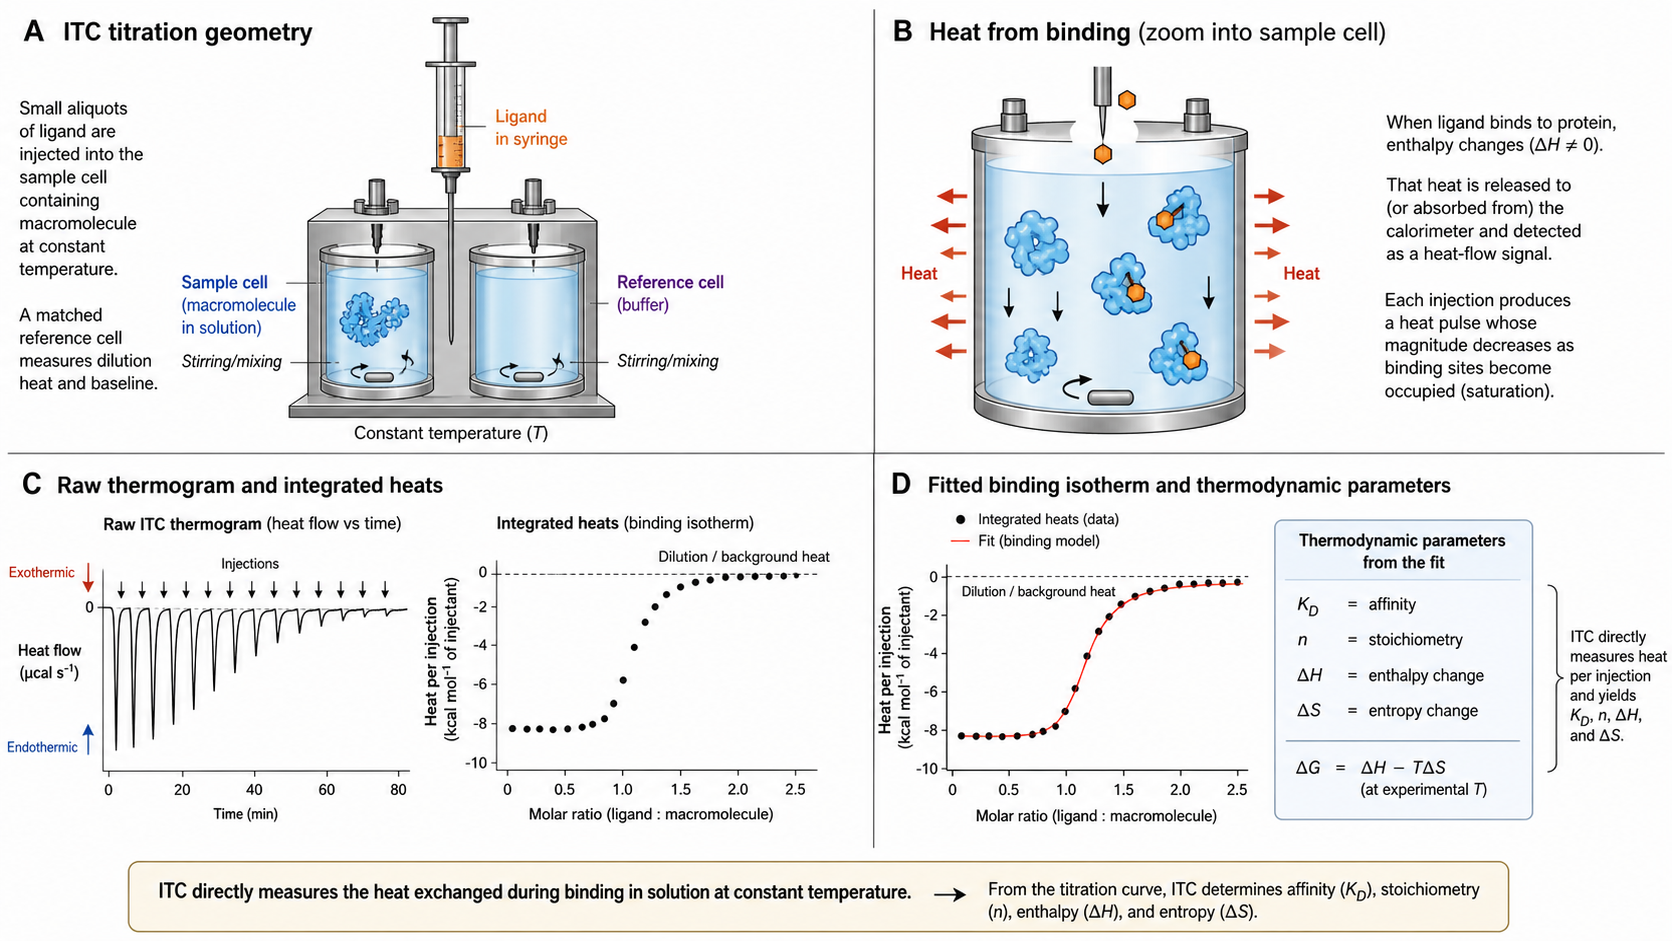
How ITC Works
An ITC instrument contains two identical coin-shaped cells enclosed in an adiabatic jacket: a reference cell (filled with water or buffer) and a sample cell (containing the macromolecule solution). A syringe loaded with the ligand is inserted into the sample cell and performs a series of precisely controlled injections.
Practical essentials: macromolecule and ligand solutions must be in matched buffer (ideally by dialysis into a common buffer) to minimize heats of dilution. If the binding event involves proton uptake or release, the measured ΔH includes the buffer ionization enthalpy and will differ between TRIS, HEPES, phosphate, etc. — repeating the titration in two buffers of different ΔHion resolves the proton stoichiometry. Always run a ligand-into-buffer control and subtract the residual heat of dilution from the binding isotherm. Samples should be degassed, and the first injection is conventionally discarded (diffusion across the syringe tip during equilibration biases its volume and heat).
The Measurement Principle
A feedback heater maintains zero temperature difference (ΔT = 0) between sample and reference cells. When ligand is injected and binding occurs, heat is released (exothermic) or absorbed (endothermic). The instrument adjusts the feedback power to compensate — this change in power (µcal/sec) is the raw ITC signal. Each injection produces a heat pulse whose area is proportional to the amount of binding that occurred.
From Raw Data to Isotherm
Early injections produce large peaks (many free binding sites). As binding sites saturate, peaks progressively diminish until only the heat of dilution remains. Integrating each peak gives kcal/mol of injectant per injection. Plotting these integrated heats against the molar ratio (ligand:macromolecule) yields the binding isotherm — a sigmoidal curve fitted to extract KD, ΔH, and n.
Key Parameters from ITC
Primary Parameters
- ΔH — Enthalpy of binding (kcal/mol), the only parameter directly measured by ITC — obtained from integrated injection peak areas.
- KD — Dissociation constant, from nonlinear least-squares fit of the binding isotherm. Typical ITC range: ~1 nM to ~1 mM.
- n — Binding stoichiometry, from the inflection point (molar ratio at midpoint) of the fitted isotherm. n = 1.0 for 1:1 binding; deviations indicate active fraction issues or complex stoichiometry.
Derived Parameters
- ΔG — Gibbs free energy: ΔG = −RT ln Ka = RT ln KD. At 25°C, KD = 1 nM corresponds to ΔG ≈ −12.3 kcal/mol.
- −TΔS — Entropic contribution: −TΔS = ΔG − ΔH. Reveals whether binding is enthalpically or entropically driven.
- c-value (Wiseman parameter): c = n × [M]total / KD. Determines the shape and information content of the isotherm.
The Wiseman c-value
The c-value (c = n × [M]total / KD) is the single most important experimental design parameter in ITC. It determines the shape of the binding isotherm and therefore what information can be extracted.
c < 1 — Too Low
Featureless, nearly linear curve. Cannot determine stoichiometry (n) — must be fixed. KD and ΔH become correlated. Low-c ITC is sometimes used for weak binders (>100 µM) with n fixed to 1, but data quality is limited.
c = 10–100 — Ideal
Well-defined sigmoidal isotherm. All three parameters (KD, ΔH, n) are independently determined with good precision. The sweet spot for most ITC experiments. Aim for c ≈ 10–50 when possible.
c > 1000 — Too High
Step-function isotherm — the transition is so sharp that KD cannot be reliably determined (only an upper limit). ΔH and n remain accurate. Dilute the macromolecule or switch to competitive/displacement ITC for tight binders.
Practical range: c = 1–1000. The usable window is c = 5–500, with 10–100 being optimal. Design your experiment by choosing [M] to place c in the sweet spot for your expected KD.
ITC vs SPR/BLI — Complementary Techniques
🌡️ ITC
- Measures thermodynamics: ΔH, ΔS, ΔG, KD, n
- True solution-phase — no immobilization artifacts
- No labeling, no surface chemistry required
- Higher sample consumption (~200–300 µL at 5–50 µM)
- No kinetic information (ka, kd)
- Lower throughput (~1–2 hours per titration)
✨ SPR / 💡 BLI
- Measures kinetics: ka, kd, and KD
- Surface-based — requires immobilization of one partner
- Low sample consumption (~50–200 µL at nM–µM)
- Real-time binding curves (sensorgrams)
- No direct thermodynamic information (ΔH, ΔS can be estimated indirectly via van't Hoff analysis at multiple temperatures)
- Higher throughput, especially with multi-channel SPR
Best practice: Use ITC and SPR/BLI together. SPR provides kinetics (how fast molecules bind and release), while ITC provides thermodynamics (the energetic driving forces). KD from both techniques should agree — this serves as powerful orthogonal validation.
Applications
Drug Discovery
Enthalpy–entropy compensation is the hidden trap of medicinal chemistry: optimizing affinity by adding hydrophobic groups may improve −TΔS but worsen ΔH, leading to diminishing returns. ITC distinguishes enthalpic binders (better specificity, drug-like) from entropic binders (often promiscuous). Essential for lead optimization.
Protein–Protein Interactions
ITC directly measures stoichiometry — critical for characterizing oligomeric complexes, multivalent interactions, and allosteric systems. Cooperativity (Hill coefficient) can be assessed from sequential binding site models. No size or label constraints — even large complexes are measurable.
Orthogonal Validation
ITC provides an independent KD measurement in solution — the gold standard for validating SPR/BLI results. If your SPR KD and ITC KD agree, you can be confident the interaction is real and the surface-based measurement is artifact-free. Regulatory agencies increasingly expect orthogonal confirmation.
Instruments using ITC
MicroCal PEAQ-ITC (Malvern Panalytical) — Current gold-standard ITC platform. 200 µL cell, power-compensation design, high sensitivity · MicroCal VP-ITC — Classic large-cell (~1.4 mL) instrument, widely used in legacy datasets · MicroCal iTC200 — Predecessor to PEAQ-ITC, still widely used in core facilities · MicroCal Auto-iTC200 — Automated iTC200 with robotic sample handling for higher throughput screening · Affinity ITC (TA Instruments) — Low-volume cell (~185 µL), auto-injection. TA's ITC line uses a solid-state thermoelectric temperature control design (versus MicroCal's power-compensation) · Nano ITC (TA Instruments) — Standard configuration uses a ~1 mL cell for higher signal-to-noise on weakly binding or low-enthalpy systems; a separate low-volume variant uses a ~190 µL cell
Related Topics
Have SPR or BLI data?
Upload your raw files and get an automated kinetic analysis in minutes. We support Biacore, Octet, and other major formats.
Upload & Analyze